Question: 2. EVENT-DRIVEN WAITING LINE ANALYSIS (CONDITION: OBSERVE FOR FIVE HOURS EACH FOR FIVE CONSECUTIVE DAYS) 2.1 Choose any relevant service organisation in South Africa where

2. EVENT-DRIVEN WAITING LINE ANALYSIS (CONDITION: OBSERVE FOR FIVE HOURS EACH FOR FIVE CONSECUTIVE DAYS)
2.1 Choose any relevant service organisation in South Africa where you will execute a waiting line/ queueing analysis.
2.1.1 Describe with the aid of a diagram, the queueing system configuration exhibited by the service organisation. [5]
2.1.2 For five days at a consistent time interval for five (5) hours; in a specified functional section or department of
the identified service organisation of your choice, compile a table with the following; [10] Table 1. Arrival and service rate of customers in a day
Period Customer Arrival Rate Customer Service Rate E.g. 9am to 10am 10 customers per hour 5 customers per hour
2.1.3 Using the customer arrival and service rate data for each hour, as a potential process analyst, determine the following operating characteristics of the waiting line with a view to ascertain the efficiency of the operation carried out in this service organisation.
a. the average number of customers in the system. [5]
b. the average time a customer spends in the system. [5]
c. the average number of customers in the queue. [5]
d. the average time a customer spends waiting in the queue. [5]
e. determine the utilisation of the service facility(ies) deployed in this service organisation. [5]
f. determine the probability that there will be zero customer in this service organisation. [5]
g. determine the probability that there will be more than eight (8) customers in this service organisation. [5]
2.1.4 Plot and briefly discuss the graph of average number of customers in the queue for the five days. [5]
2.1.5 Plot and briefly discuss the graph of customer average wait time in queue for the five days. [5]
2.1.6 Based on the waiting line performance analysis results obtained in question (2.1.3), determine the following:
a) the expected number of customers in the system.
2
[5]
b) the expected time a customer spends in the system. [5]
c) the variance of the number of customers in the queue for five days. [5]
d) the variance of the customer wait time in the queue for five days. [5]
e) the standard deviation of the number of customers in the queue for five days. [5]
f) the standard deviation of the customer wait time in the queue for five days. [5]
2.1.7 Should the service organisation source extra service facility with a view service the customers? (Justify your answer based on the result of the existing waiting line performance analysis or using new waiting line performance analysis
if applicable).
[15]
 2. EVENT-DRIVEN WAITING LINE ANALYSIS (CONDITION: OBSERVE FOR FIVE HOURS EACH

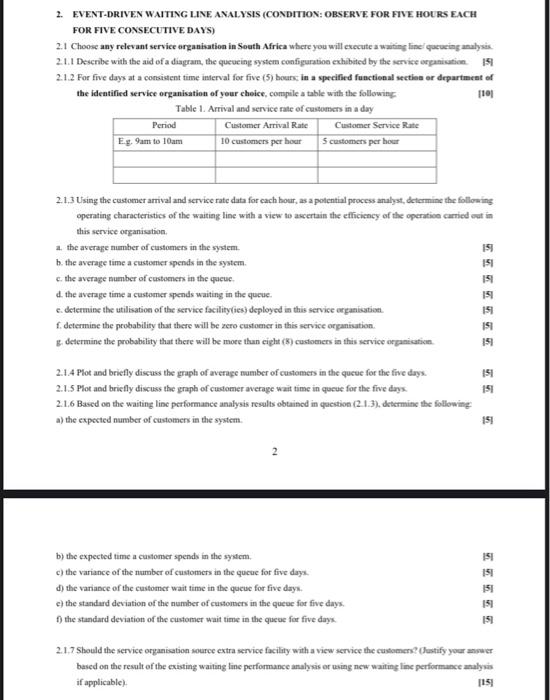
2. EVENT-DRIVEN WAITIVG LINE ANALYSIS (CONDITON: OBSERVE FOR FIVE HOLRS EACH FOR FIVE CONSECUTIVE DAYS) 2.1 Choose any relevant service organisation in South Africa where you will execute a waiting line' queucing analysas. 2.1.1 Describe with the aid of a diagram, the queveing system configuration exhibited by the service orpanicution. 19 | 2.1.2 For five days at a consistent time inierval for five (5) bours in a specified functional sectioa or department of the ideatified service organisation of your eheice, compile a table with the following [10| Table 1. Arrival and service rate of customers in a day 2.1.3 Using the customer arrival and service rate data for cach bour, as a potential process analyst, determine the following operating characteristics of the waitiag line with a view to ascertain the efficicacy of the operatioe carried eat in this service organisation. a. the average number of customers in the system. [5] b. the average time a customer spends in the system. 5 c. the average number of customens in the queue. 151 d. the average time a customer spends waiting in the queue. 191 e. determine the utilisation of the service facility(ies) deployed in this service arganisation. 151 f. determise the probability that there will be zero custoener in this service ofganisation. [5] g. determine the probability that thete will be moee than eight (5) custoeners in this service of ganication. 191 2.1.4 Plot and briefly discuss the graph of average number of customers in the queve for the five days. [5] 2.1.5 Plot and briefly discuss the graph of customer average wait time in queue for the five dayx. 151 2.1.6 Based on the waiting line performance analysis results obtained in question (2.1.3), determine the following a) the expected number of customers in the system. 15] 2 b) the expected time a customer spends in the system. |5| c) the variance of the number of customers in the quecue for five days. 15] d) the variance of the customer wait time in the queue for five days. [5] c) the standard deviation of the number of customen in the queve for five days. [5] f) the standard deviation of the customer wait time in the queve for five dayx. [5]. 2.1.7 Should the service organisation source extra service facility with a view service the custonen? (lustify your answer based on the result of the existing waiting line performance analysis er using new waiting line performunce analysis if applicable). [15]

Step by Step Solution

There are 3 Steps involved in it

1 Expert Approved Answer
Step: 1 Unlock blur-text-image
Question Has Been Solved by an Expert!

Get step-by-step solutions from verified subject matter experts

Step: 2 Unlock
Step: 3 Unlock

Students Have Also Explored These Related General Management Questions!