

Question: 2 Exercise 17-3 Computing and interpreting trend percents LO P1 0.66 points Sales Cost of goods sold Accounts receivable 2019 2018 2017 2016 2015 $
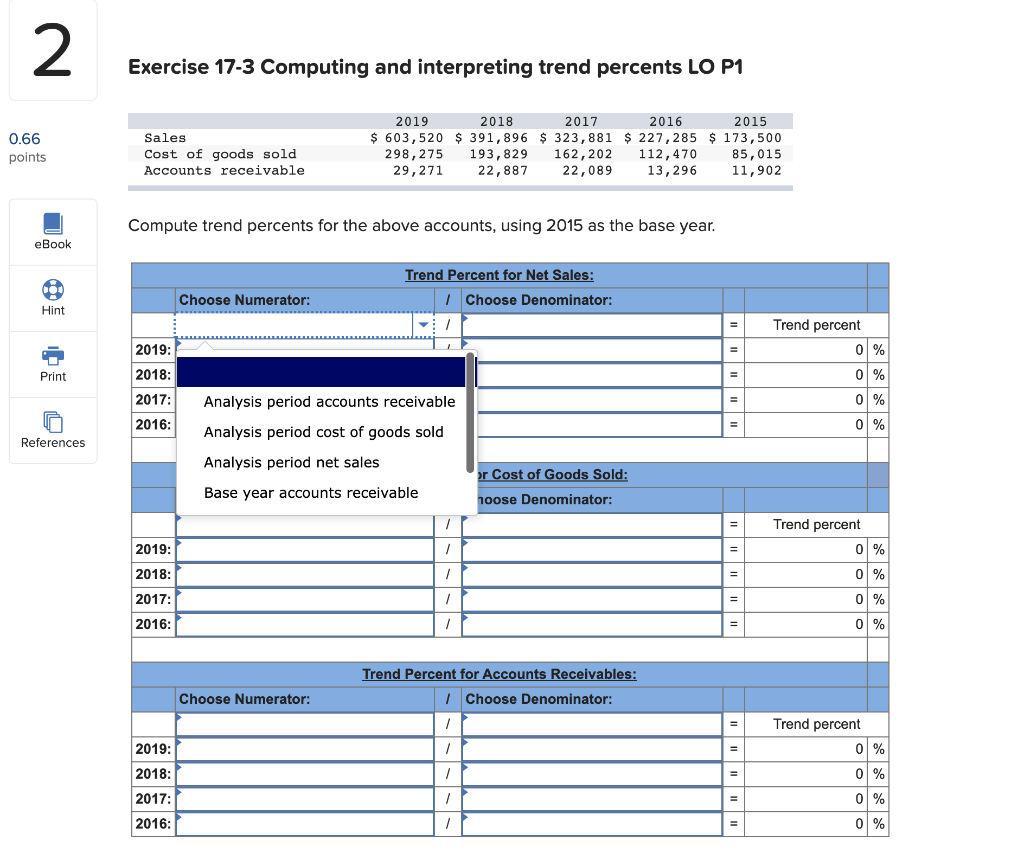
2 Exercise 17-3 Computing and interpreting trend percents LO P1 0.66 points Sales Cost of goods sold Accounts receivable 2019 2018 2017 2016 2015 $ 603,520 $ 391,896 $ 323,881 $ 227, 285 $ 173,500 298,275 193,829 162,202 112, 470 85,015 29,271 22,887 22,089 13,296 11,902 Compute trend percents for the above accounts, using 2015 as the base year. eBook Trend Percent for Net Sales: 1 Choose Denominator: Choose Numerator: Hint Trend percent 0 % 2019: Print 2018: 0 % 0 % 2017: Analysis period accounts receivable = 2016: = 0 % References Analysis period cost of goods sold Analysis period net sales or Cost of Goods Sold: Base year accounts receivable 1oose Denominator: Trend percent 0 % 2019: 1 2018: 1 0 % 2017: = 0 % 2016: 0 % Trend Percent for Accounts Receivables: Choose Denominator: Choose Numerator: Trend percent 0 % 2019: / 2018: 1 = 0 % 2017: 1 0 % 2016: = 0 %
Step by Step Solution
There are 3 Steps involved in it

Get step-by-step solutions from verified subject matter experts