

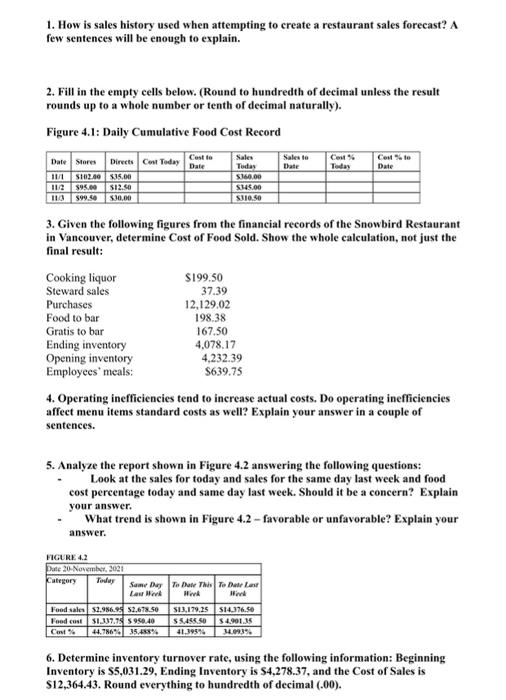
Question: 2. Fill in the empty cells below. ( Round to hundredth of decimal unless the result round s up to a whole number or tenth
2.Fill in the empty cells below. (Round to hundredth of decimal unless the result rounds up to a whole number or tenth of decimal naturally).
Figure 4.1: Daily Cumulative Food Cost Record
Date | Stores | Directs | Cost Today | Cost to Date | Sales Today | Sales to Date | Cost % Today | Cost % to Date |
11/1 | $102.00 | $35.00 |
|
| $360.00 |
|
|
|
11/2 | $95.00 | $12.50 |
|
| $345.00 |
|
|
|
11/3 | $99.50 | $30.00 |
|
| $310.50 |
|
|
|
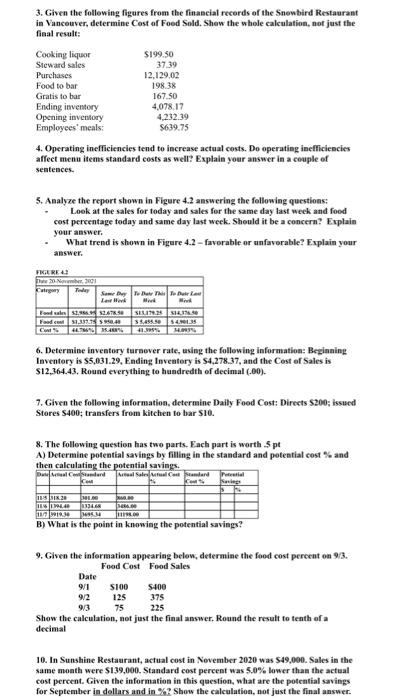
5. Analyze the report shown in Figure 4.2 answering the following questions:
- Look at the sales for today and sales for the same day last week and food cost percentage today and same day last week. Should it be a concern? Explain your answer.
-What trend is shown in Figure 4.2 favorable or unfavorable? Explain your answer.
FIGURE 4.2 | ||||
Date 20-November, 2021 | ||||
Category | Today
| Same Day Last Week | To Date This Week | To Date Last Week |
Food sales | $2,986.95 | $2,678.50 | $13,179.25 | $14,376.50 |
Food cost | $1,337.75 | $ 950.40 | $ 5,455.50 | $ 4,901.35 |
Cost % | 44.786% | 35.488% | 41.395% | 34.093% |
8. The following question has two parts. Each part is worth .5 pt
A) Determine potential savings by filling in the standard and potential cost % and then calculating the potential savings.
Date | Actual Cost | Standard Cost | Actual Sales | Actual Cost % | Standard Cost % | Potential Savings | |
|
|
|
|
|
| $ | % |
11/5 | 318.20 | 301.00 | 860.00 |
|
|
|
|
11/6 | 1394.40 | 1324.68 | 3486.00 |
|
|
|
|
11/7 | 3919.30 | 3695.34 | 11198.00 |
|
|
|
|
B) What is the point in knowing the potential savings?
9. Given the information appearing below, determine the food cost percent on 9/3.
Food Cost Food Sales
Date
9/1 $100 $400
9/2 125 375
9/3 75 225
Show the calculation, not just the final answer. Round the result to tenth of a decimal
1. How is sales history used when attempting to create a restaurant sales forecast? A few sentences will be enough to explain. 2. Fill in the empty cells below. (Round to hundredth of decimal unless the result rounds up to a whole number or tenth of decimal naturally). Figure 4.1: Daily Cumulative Food Cost Record Cost to Date Sales to Cost Today Cost to Date Date Stores Directs Cost Today 101 512.00 SUS.00 112 595.00 $12.50 La 599.50 $10.00 Sales Today $160.00 S145.00 $310.50 3. Given the following figures from the financial records of the Snowbird Restaurant in Vancouver, determine Cost of Food Sold. Show the whole calculation, not just the final result: Cooking liquor $199.50 Steward sales 37.39 Purchases 12.129.02 Food to bar 198.38 Gratis to bar 167.50 Ending inventory 4,078,17 Opening inventory 4.232.39 Employees' meals: S639.75 4. Operating inefficiencies tend to increase actual costs. Do operating inefficiencies affect menu items standard costs as well? Explain your answer in a couple of sentences. 5. Analyze the report shown in Figure 4.2 answering the following questions: Look at the sales for today and sales for the same day last week and food cost percentage today and same day last week. Should it be a concern? Explain your answer. What trend is shown in Figure 4.2 - favorable or unfavorable? Explain your answer. FIGURE 4.2 Pate 20-November, 2021 Category Todes Same Day To Date This To Date Last Les Werk Hind Wind Food sales 52.986.95 52.678.50 $13.179.15 514.76.50 Food cost 51.117.95 5950.40 S5.456.50 54,901.35 Cent 44.786835.8% 41.395% 34093 6. Determine inventory turnover rate, using the following information: Beginning Inventory is $5,031.29, Ending Inventory is $4,278.37, and the Cost of Sales is $12,364.43. Round everything to hundredth of decimal(.00). 3. Given the following figures from the financial records of the Snowbird Restaurant in Vancouver, determine Cost of Food Sold. Show the whole calculation, not just the final result: Cooking liquor $199.50 Steward sales 37.39 Purchases 12.129.02 Food to bar 198.38 Gratis to bar 167.50 Ending inventory 4,078.17 Opening inventory 4.232.39 Employees' meals: 5639.75 4. Operating inefficiencies tend to increase actual costs. Do operating inefficiencies affect menu items standard costs as well? Explain your answer in a couple of sentences. 5. Analyze the report shown in Figure 4.2 answering the following questions: Look at the sales for today and sales for the same day last week and food cost percentage today and same day last week. Should it be a concern? Explain your answer. What trend is shown in Figure 4.2 - favorable or unfavorable? Explain your answer. FRIERKA hehe 301 Tuley Sum Dey To Be The Tour La M Med Bondale 2 STK. SEITSS12:3750 Food cul 31,337555980.00 388554901:35 Cont 11:13 pers 6. Determine inventory turnover rate, using the following information: Beginning Inventory is $5,031.29. Ending Inventory is $4.278.37, and the Cost of Sales is $12.364.43. Round everything to hundredth of decimal(.00). 7. Given the following information, determine Daily Food Cost: Directs S200; issued Stores $400; transfers from kitchen to bar $10. 8. The following question has two parts. Each part is worth 5 pt A) Determine potential savings by filling in the standard and potential cost and then calculating the potential savings. ullular Thraal salutail milar Tamil Com 113 K.30 LG IES TOLD 1919.30 WIB B) What is the point in knowing the potential savings? 9. Given the information appearing below, determine the food cost percent on 93. Food Cost Food Sales Date 9/1 S100 5400 9/2 125 375 93 75 Show the calculation, not just the final answer. Round the result to tenth of a decimal 225 10. In Sunshine Restaurant, actual cost in November 2020 was $49,000. Sales in the same month were $139,000. Standard cost percent was 5.0% lower than the actual cost percent. Given the information in this question, what are the potential savings for September in dollars and in %? Show the calculation, not just the final
Step by Step Solution
There are 3 Steps involved in it

Get step-by-step solutions from verified subject matter experts