

Question: 2. For each binomial distribution given below, (a) display a table of values and (b) draw a histogram. (c) Explain how the shape of the
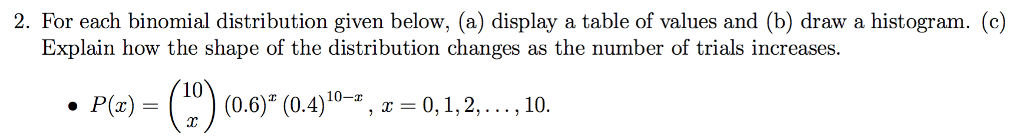
2. For each binomial distribution given below, (a) display a table of values and (b) draw a histogram. (c) Explain how the shape of the distribution changes as the number of trials increases 10 10-I 10
Step by Step Solution
There are 3 Steps involved in it
1 Expert Approved Answer
Step: 1 Unlock

Question Has Been Solved by an Expert!
Get step-by-step solutions from verified subject matter experts
Step: 2 Unlock
Step: 3 Unlock