

Question: Find the standard deviation. Comment on your answer. 10 Consider the following two data sets: Data set I: 13, 25, 27, 15 Data set II:
Find the standard deviation. Comment on your answer.
10 Consider the following two data sets:
Data set I: 13, 25, 27, 15
Data set II: 10, 15, 30, 25
Find the mean and the standard deviations for each data set of
the two data sets above. Comment on your answer.
11 Fatima is currently taking college economics. The instructor
often gives quizzes. On the past five quizzes, Fatima got the
following scores
5, 19, 2, 13, 10
Find the range for her scores.
12 The owner of a small manufacturing plant employs six people.
As part of their personal file, she asked each one to record to
the nearest one-tenth of a mile the distance they travel one
way from home to work. The six distances are listed below.
2.3, 5.5, 1.1, 4.3, 6.4, 3.5
Find the range for these data.
Question
a) A descriptive statistics table and correlation matrix for manufacturing growth and the predictor growth variables. Note the simple relationships between manufacturing growth and the predictor growth variables. In addition, discuss the importance of multicollinearity and use the VIF to test for multicollinearity.
b. A multiple regression analysis of manufacturing growth on the predictor growth variables.
Remove any nonsignificant predictor variables, one at a time, from the regression model. Indicate
your best final model and discuss.
(ii). Interpret the meaning of the slopes in this equation.
(iii). Perform a residual analysis of the results and determine whether the regression assumptions
are valid.
(iv). Determine whether there is a significant relationship between manufacturing growth and the
two independent variables (agricultural growth and exports growth) at the 0.05 level of significance.
(v). Determine the p-value in the residual (iii) and interpret its meaning.
(vi). Interpret the meaning of the coefficient of multiple determination in this problem.
(vii). Determine the adjusted R2
(viii). At the 0.05 level of significance, determine whether each independent variable makes a
significant contribution to the regression model. Indicate the most appropriate regression model for
this set of data.
(ix). Determine the p-values in (i) and interpret their meaning
(x). Construct a 95% confidence interval estimate of the population slope between manufacturing growth and export growth.
c. State the conclusions from your analysis and discuss the conditional importance of the variables in
terms of their relationship to manufacturing growth.
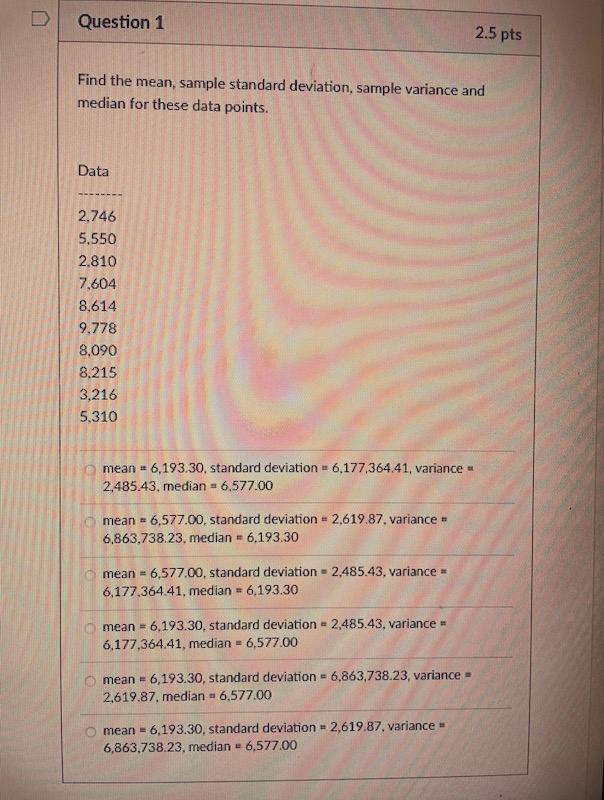
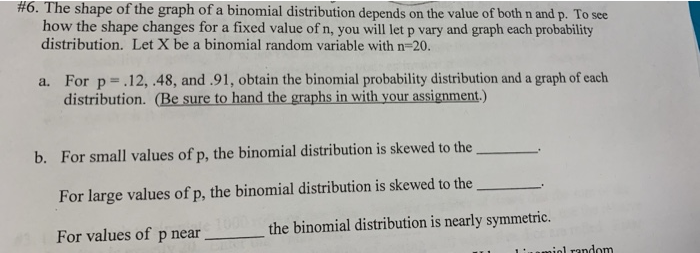
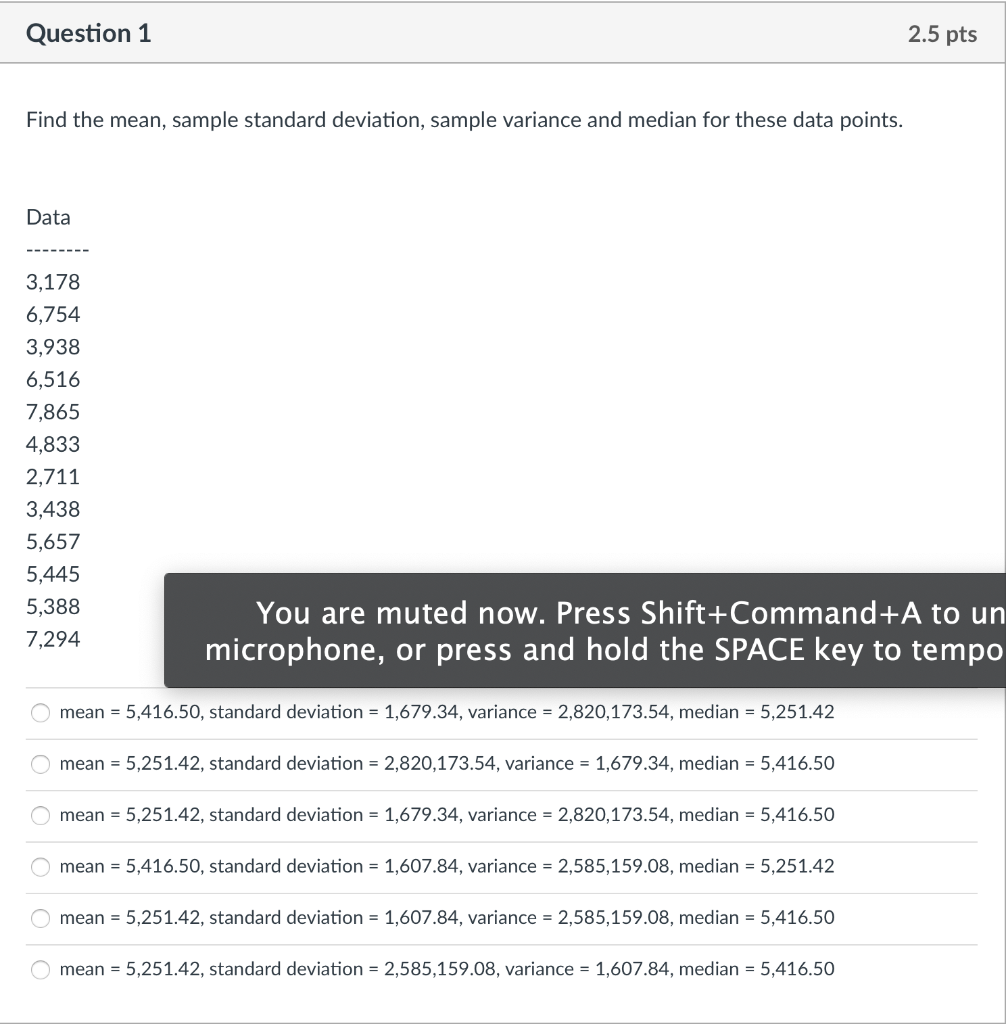
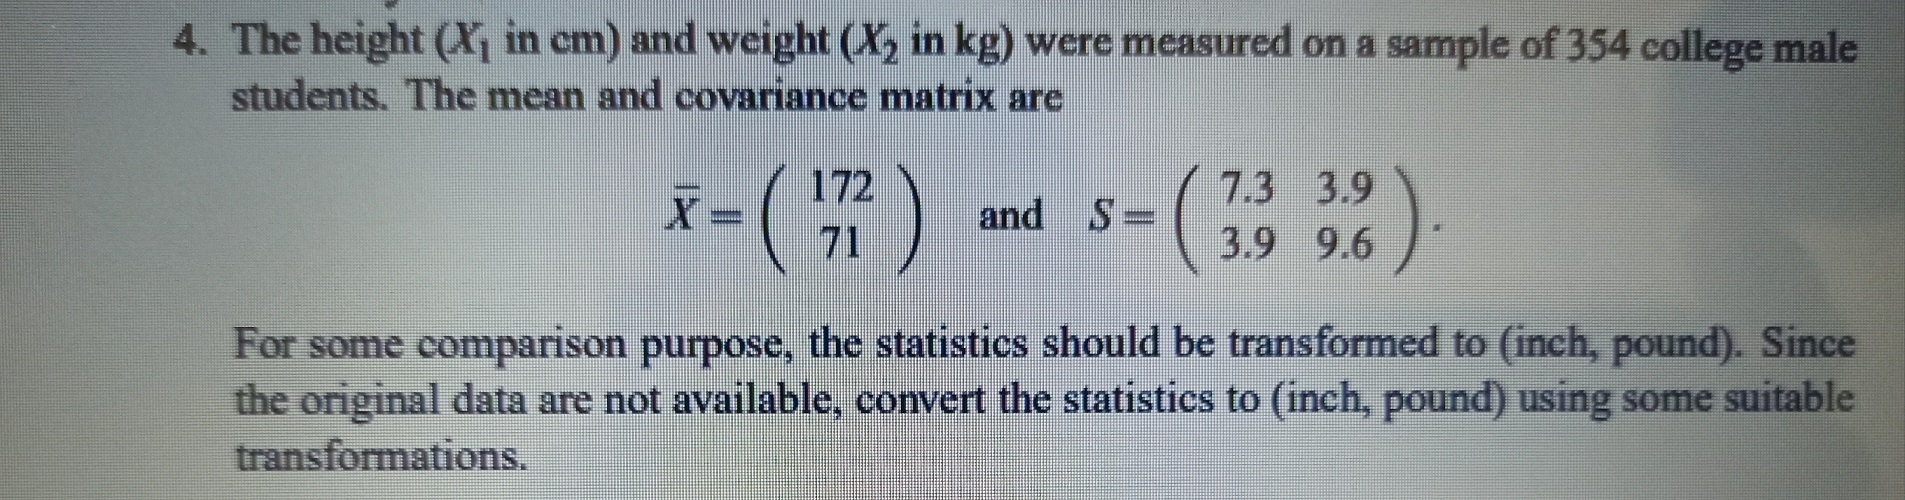
D Question 1 2.5 pts Find the mean, sample standard deviation, sample variance and median for these data points. Data 2.746 5,550 2.810 7.604 8.614 9.778 8,090 8,215 3,216 5.310 mean = 6,193.30, standard deviation = 6,177,364.41, variance = 2,485.43, median = 6.577.00 mean = 6.577.00, standard deviation = 2.619.87. variance = 6.863.738.23, median = 6.193.30 mean = 6,577.00, standard deviation = 2,485.43, variance = 6,177.364.41, median = 6,193.30 mean = 6.193.30. standard deviation = 2,485.43, variance = 6,177,364.41, median = 6,577.00 mean = 6,193.30, standard deviation = 6.863,738.23, variance = 2,619.87, median = 6.577.00 O mean = 6,193.30, standard deviation = 2,619.87, variance = 6,863.738.23, median = 6,577.00#6. The shape of the graph of a binomial distribution depends on the value of both n and p. To see how the shape changes for a fixed value of n, you will let p vary and graph each probability distribution. Let X be a binomial random variable with n=20. a. For p=.12, .48, and .91, obtain the binomial probability distribution and a graph of each distribution. (Be sure to hand the graphs in with your assignment.) b. For small values of p, the binomial distribution is skewed to the For large values of p, the binomial distribution is skewed to the For values of p near 100 the binomial distribution is nearly symmetric.Question 1 2.5 pts Find the mean, sample standard deviation, sample variance and median for these data points. 5388 You are muted now. Press Shift+Command+A to un microphone, or press and hold the SPACE key to tempo -"\"- mean = 5,416.50, standard deviation = 1,679.34, variance = 2,820,173.54, median = 5,251.42 C\" mean = 5,251.42, standard deviation = 2,820,173.54, variance = 1,679.34. median = 5,416.50 7\"- mean = 5,251.42, standard deviation = 1,679.34, variance = 2,820,173.54, median = 5,416.50 mean = 5,416.50, standard deviation = 1,607.84. variance = 2,585,159.08. median = 5,251.42 mean = 5,251.42, standard deviation = 1,607.84, variance = 2,585,159.08, median = 5,416.50 -"'- mean = 5,251.42, standard deviation = 2,585,159.08, variance = 1,607.84, median = 5,416.50 4. The height (X, in cm) and weight (X2 in kg) were measured on a sample of 354 college male students. The mean and covariance matrix are 172 X = 7.3 3.9 71 and S = 3.9 9.6 For some comparison purpose, the statistics should be transformed to (inch, pound). Since the original data are not available, convert the statistics to (inch, pound) using some suitable transformations
Step by Step Solution
There are 3 Steps involved in it

Get step-by-step solutions from verified subject matter experts