

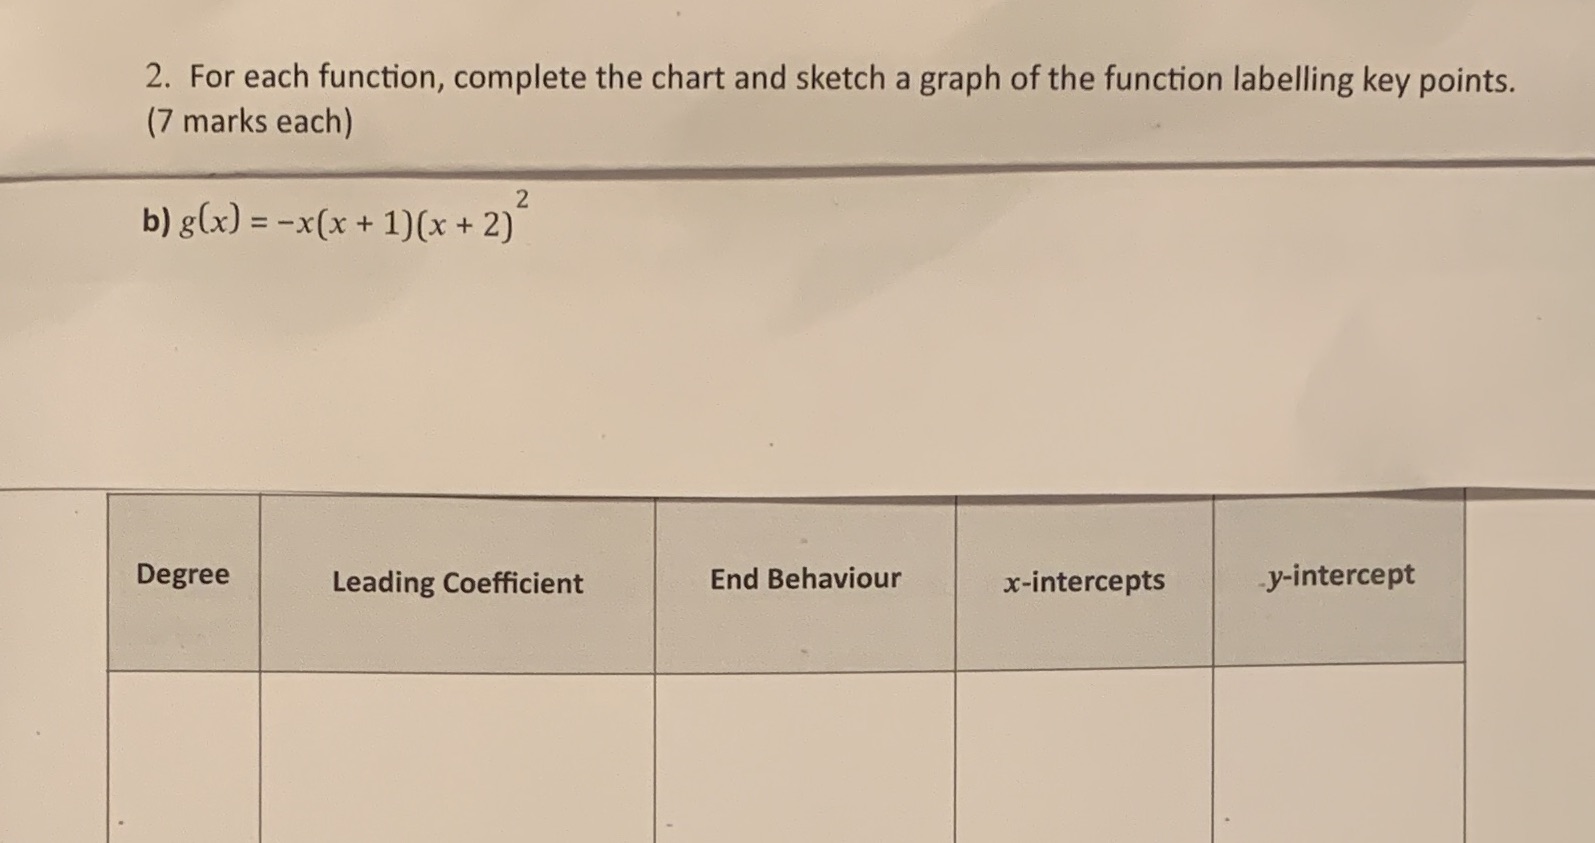
Question: 2. For each function, complete the chart and sketch a graph of the function labelling key points. (7 marks each) 2 b) g (x) =
Step by Step Solution
There are 3 Steps involved in it
1 Expert Approved Answer
Step: 1 Unlock

Question Has Been Solved by an Expert!
Get step-by-step solutions from verified subject matter experts
Step: 2 Unlock
Step: 3 Unlock