

Question: 2) For the reaction shown below, the data depicted in the given chart were obtained. For each solvent, the average of eight GC integral measurements
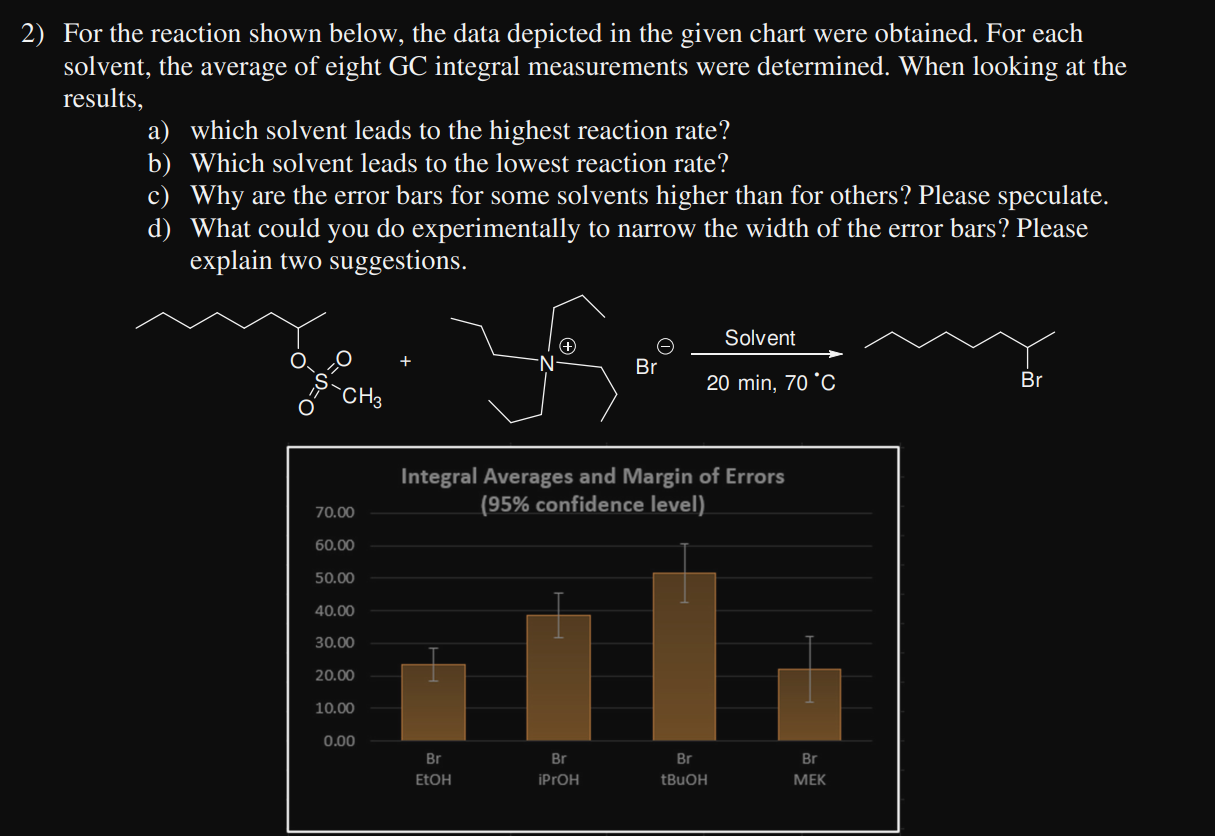
2) For the reaction shown below, the data depicted in the given chart were obtained. For each solvent, the average of eight GC integral measurements were determined. When looking at the results, a) which solvent leads to the highest reaction rate? b) Which solvent leads to the lowest reaction rate? c) Why are the error bars for some solvents higher than for others? Please speculate. d) What could you do experimentally to narrow the width of the error bars? Please explain two suggestions
Step by Step Solution
There are 3 Steps involved in it
1 Expert Approved Answer
Step: 1 Unlock

Question Has Been Solved by an Expert!
Get step-by-step solutions from verified subject matter experts
Step: 2 Unlock
Step: 3 Unlock