

Question: 2. Given a multivariate normal random vector X = (X1, X2, X3, X4, X) with = E(X) (3,4,5,6,7) = 8.8 -2.5 2.1 2.7 3.2
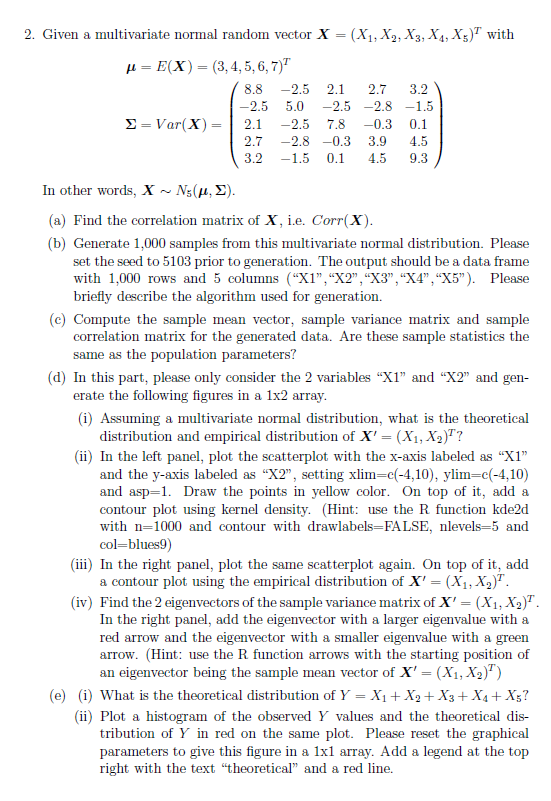
2. Given a multivariate normal random vector X = (X1, X2, X3, X4, X)" with = E(X) (3,4,5,6,7) = 8.8 -2.5 2.1 2.7 3.2 -2.5 5.0 -2.5 -2.8 -1.5 = Var(x)= 2.1 -2.5 7.8 -0.3 0.1 2.7 -2.8 -0.3 3.9 4.5 3.2 -1.5 0.1 4.5 9.3 In other words, X ~ .(, ). (a) Find the correlation matrix of X, i.e. Corr(X). (b) Generate 1,000 samples from this multivariate normal distribution. Please set the seed to 5103 prior to generation. The output should be a data frame with 1,000 rows and 5 columns ("X1", "X2", "X3", "X4", "X5"). Please briefly describe the algorithm used for generation. (c) Compute the sample mean vector, sample variance matrix and sample correlation matrix for the generated data. Are these sample statistics the same as the population parameters? (d) In this part, please only consider the 2 variables "X1" and "X2" and gen- erate the following figures in a 1x2 array. (i) Assuming a multivariate normal distribution, what is the theoretical distribution and empirical distribution of X' = (X1, X2)T? (ii) In the left panel, plot the scatterplot with the x-axis labeled as "X1" and the y-axis labeled as "X2", setting xlim=c(-4,10), ylim=c(-4,10) and asp 1. Draw the points in yellow color. On top of it, add a contour plot using kernel density. (Hint: use the R function kde2d with n=1000 and contour with drawlabels=FALSE, nlevels-5 and col-blues9) (iii) In the right panel, plot the same scatterplot again. On top of it, add a contour plot using the empirical distribution of X' = (X1, X2)T. (iv) Find the 2 eigenvectors of the sample variance matrix of X' = (X1, X2). In the right panel, add the eigenvector with a larger eigenvalue with a red arrow and the eigenvector with a smaller eigenvalue with a green arrow. (Hint: use the R function arrows with the starting position of an eigenvector being the sample mean vector of X' = (X1, X2)T) (e) (i) What is the theoretical distribution of Y = X+X2+X3+X4+X5? (ii) Plot a histogram of the observed Y values and the theoretical dis- tribution of Y in red on the same plot. Please reset the graphical parameters to give this figure in a 1x1 array. Add a legend at the top right with the text "theoretical" and a red line.
Step by Step Solution
There are 3 Steps involved in it

Get step-by-step solutions from verified subject matter experts