

Question: 2. Given the project data in the table below, Draw a fully analyzed network diagram for the project, showing all ES, EF, LS and
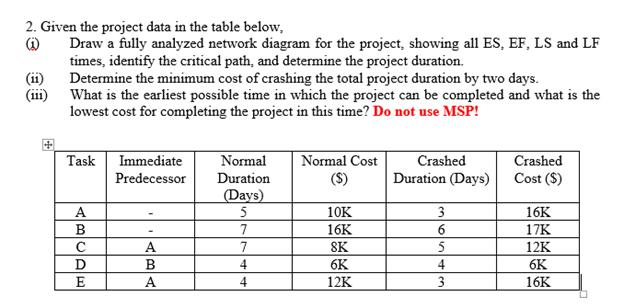
2. Given the project data in the table below, Draw a fully analyzed network diagram for the project, showing all ES, EF, LS and LF times, identify the critical path, and determine the project duration. Determine the minimum cost of crashing the total project duration by two days. What is the earliest possible time in which the project can be completed and what is the lowest cost for completing the project in this time? Do not use MSP! Task A B D E Immediate Predecessor A B A Normal Duration (Days) 5 7 7 4 4 Normal Cost (S) 10K 16K SK 6K 12K Crashed Duration (Days) 3 6 5 4 3 Crashed Cost ($) 16K 17K 12K 6K 16K
Step by Step Solution
There are 3 Steps involved in it
ANSWER To draw the network diagram and perform the analysis lets start by organizing the tasks and their dependencies Task A has no dependencies Task ... View full answer

Get step-by-step solutions from verified subject matter experts