

Question: 2. In Column D Use Excel > Data> Data Analysis> Moving Average to calculate the moving average. See the menu box gure above for menu
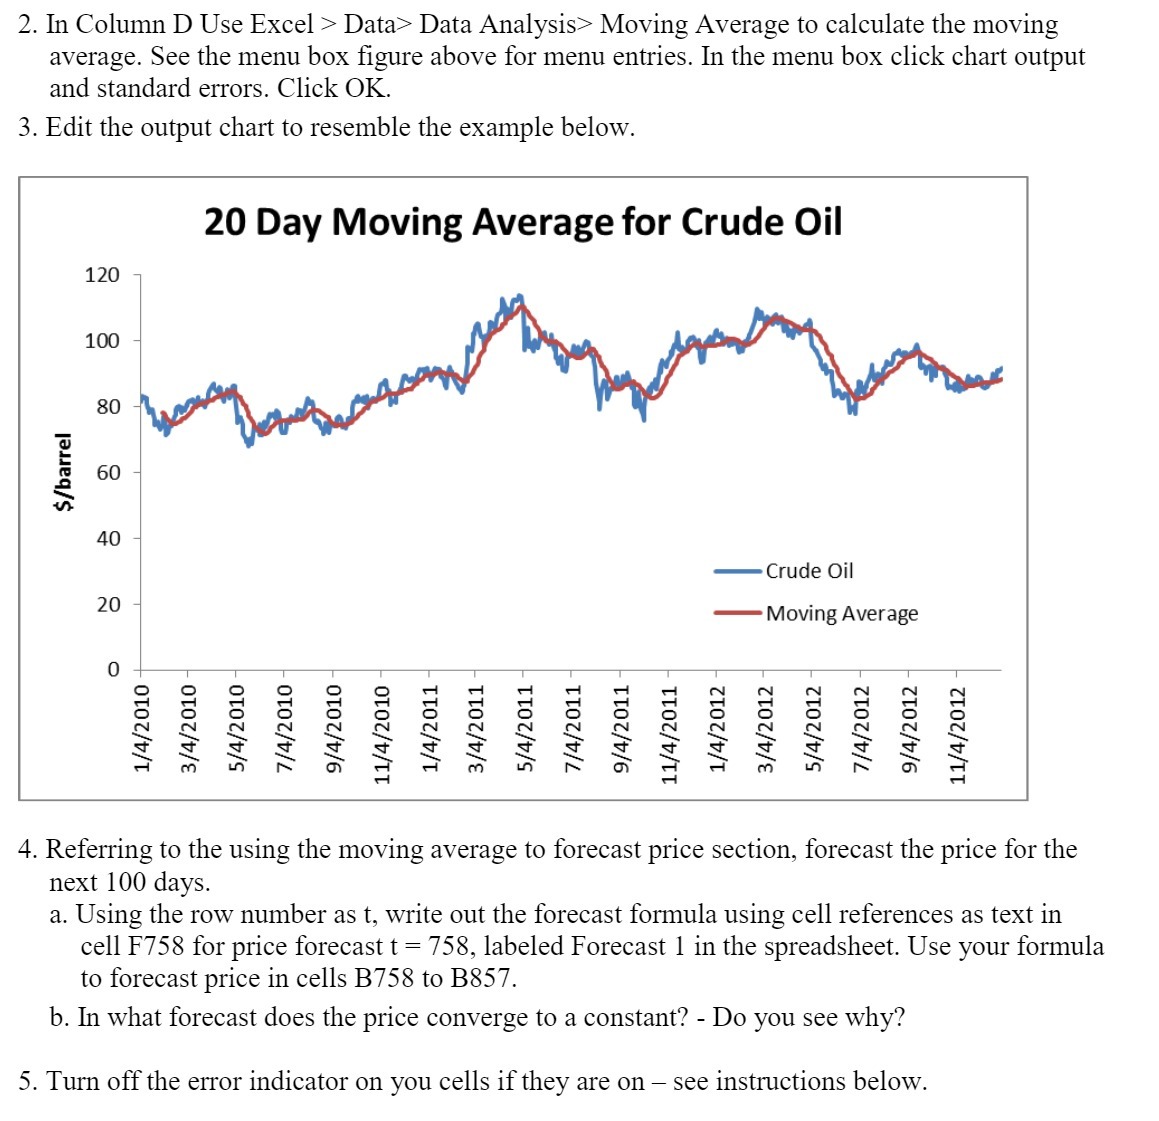

2. In Column D Use Excel > Data> Data Analysis> Moving Average to calculate the moving average. See the menu box gure above for menu entries. In the menu box click chart output and standard errors. Click OK. 3. Edit the output chart to resemble the example below. 20 Day Moving Average for Crude Oil Crude Oil M oving Average 1/4/2010 3/4/2010 5/4/2010 7/4/2010 9/4/2010 11/4/2010 ~ 1/4/2011 - 3/4/2011 5/4/2011 - 7/4/2011 - 9/4/2011 - 11/4/2011 - 1/4/2012 3/4/2012 - 5/4/2012 - 7/4/2012 9/4/2012 11/4/2012 4. Referring to the using the moving average to forecast price section, forecast the price for the next 100 days. 3. Using the row number as t, write out the forecast formula using cell references as text in cell F758 for price forecast t = 758, labeled Forecast 1 in the spreadsheet. Use your formula to forecast price in cells B758 to B857. b. In what forecast does the price converge to a constant? - Do you see why? 5. Turn off the error indicator on you cells if they are on see instructions below
Step by Step Solution
There are 3 Steps involved in it

Get step-by-step solutions from verified subject matter experts