

Question: 2. In the following graph, an object's velocity is graphed. Use this graph to determine the object's position at t = 20, 40, 60, 80,
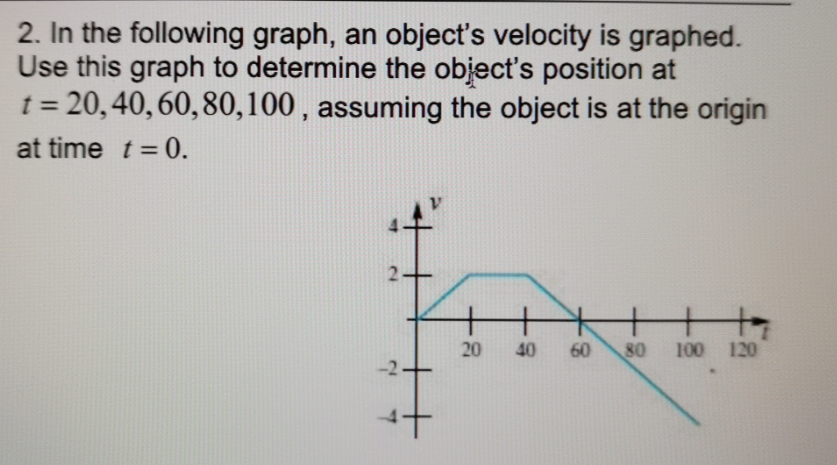

2. In the following graph, an object's velocity is graphed. Use this graph to determine the object's position at t = 20, 40, 60, 80, 100, assuming the object is at the origin at time t = 0. 2- 20 40 60 80 100 120 -2
Step by Step Solution
There are 3 Steps involved in it
1 Expert Approved Answer
Step: 1 Unlock

Question Has Been Solved by an Expert!
Get step-by-step solutions from verified subject matter experts
Step: 2 Unlock
Step: 3 Unlock