

Question: 2. Interpret your output from cross-tab 2 a. Is the relationship between these variables significant? (2 point) b. Identify and interpret gamma (2 points) c.
2. Interpret your output from cross-tab 2 a. Is the relationship between these variables significant? (2 point) b. Identify and interpret gamma (2 points) c. Identify and interpret Kendall's tau-b (2 points)
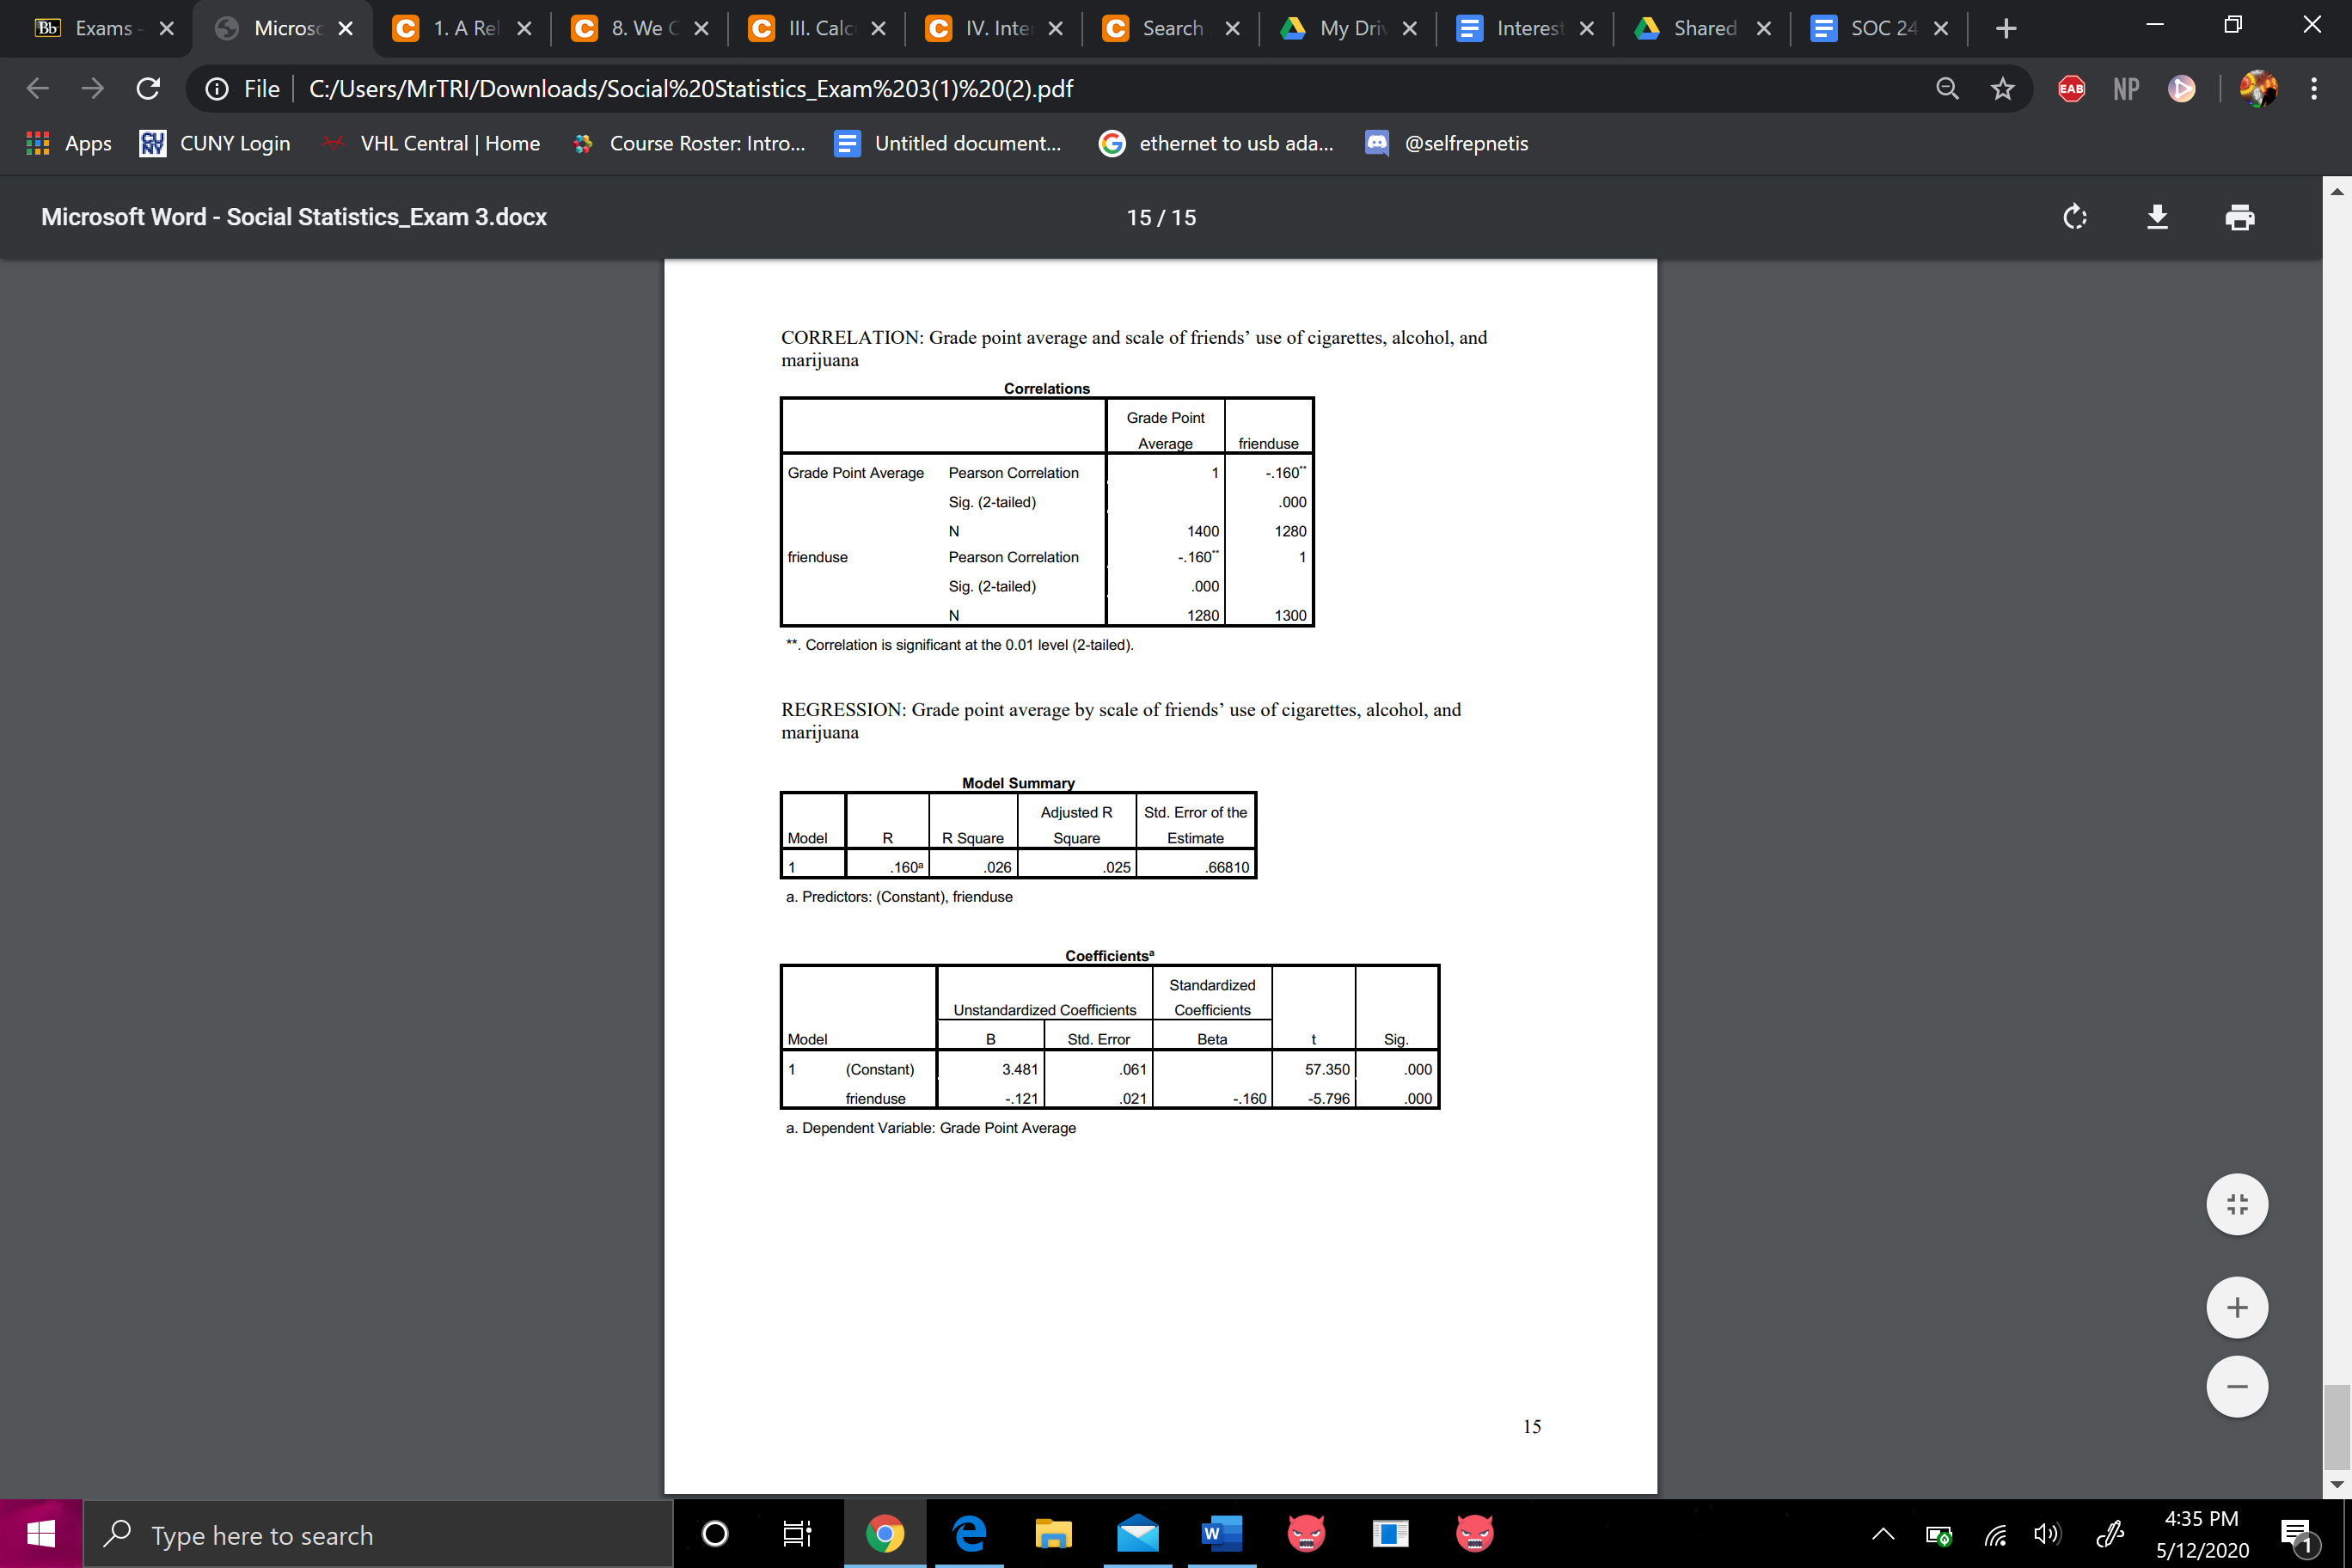
3. Interpret your output from the correlation analysis a. Identify and interpret r, the correlation coefficient (2 points)
4. Interpret your output from the regression analysis a. Identify the independent and dependent variables (1 points) b. Identify and interpret r2 (2 points) c. Identify and interpret the y-intercept (2 points) d. Identify and interpret the slope (2 points) e. Write the regression equation using the information available from this analysis (3 points)
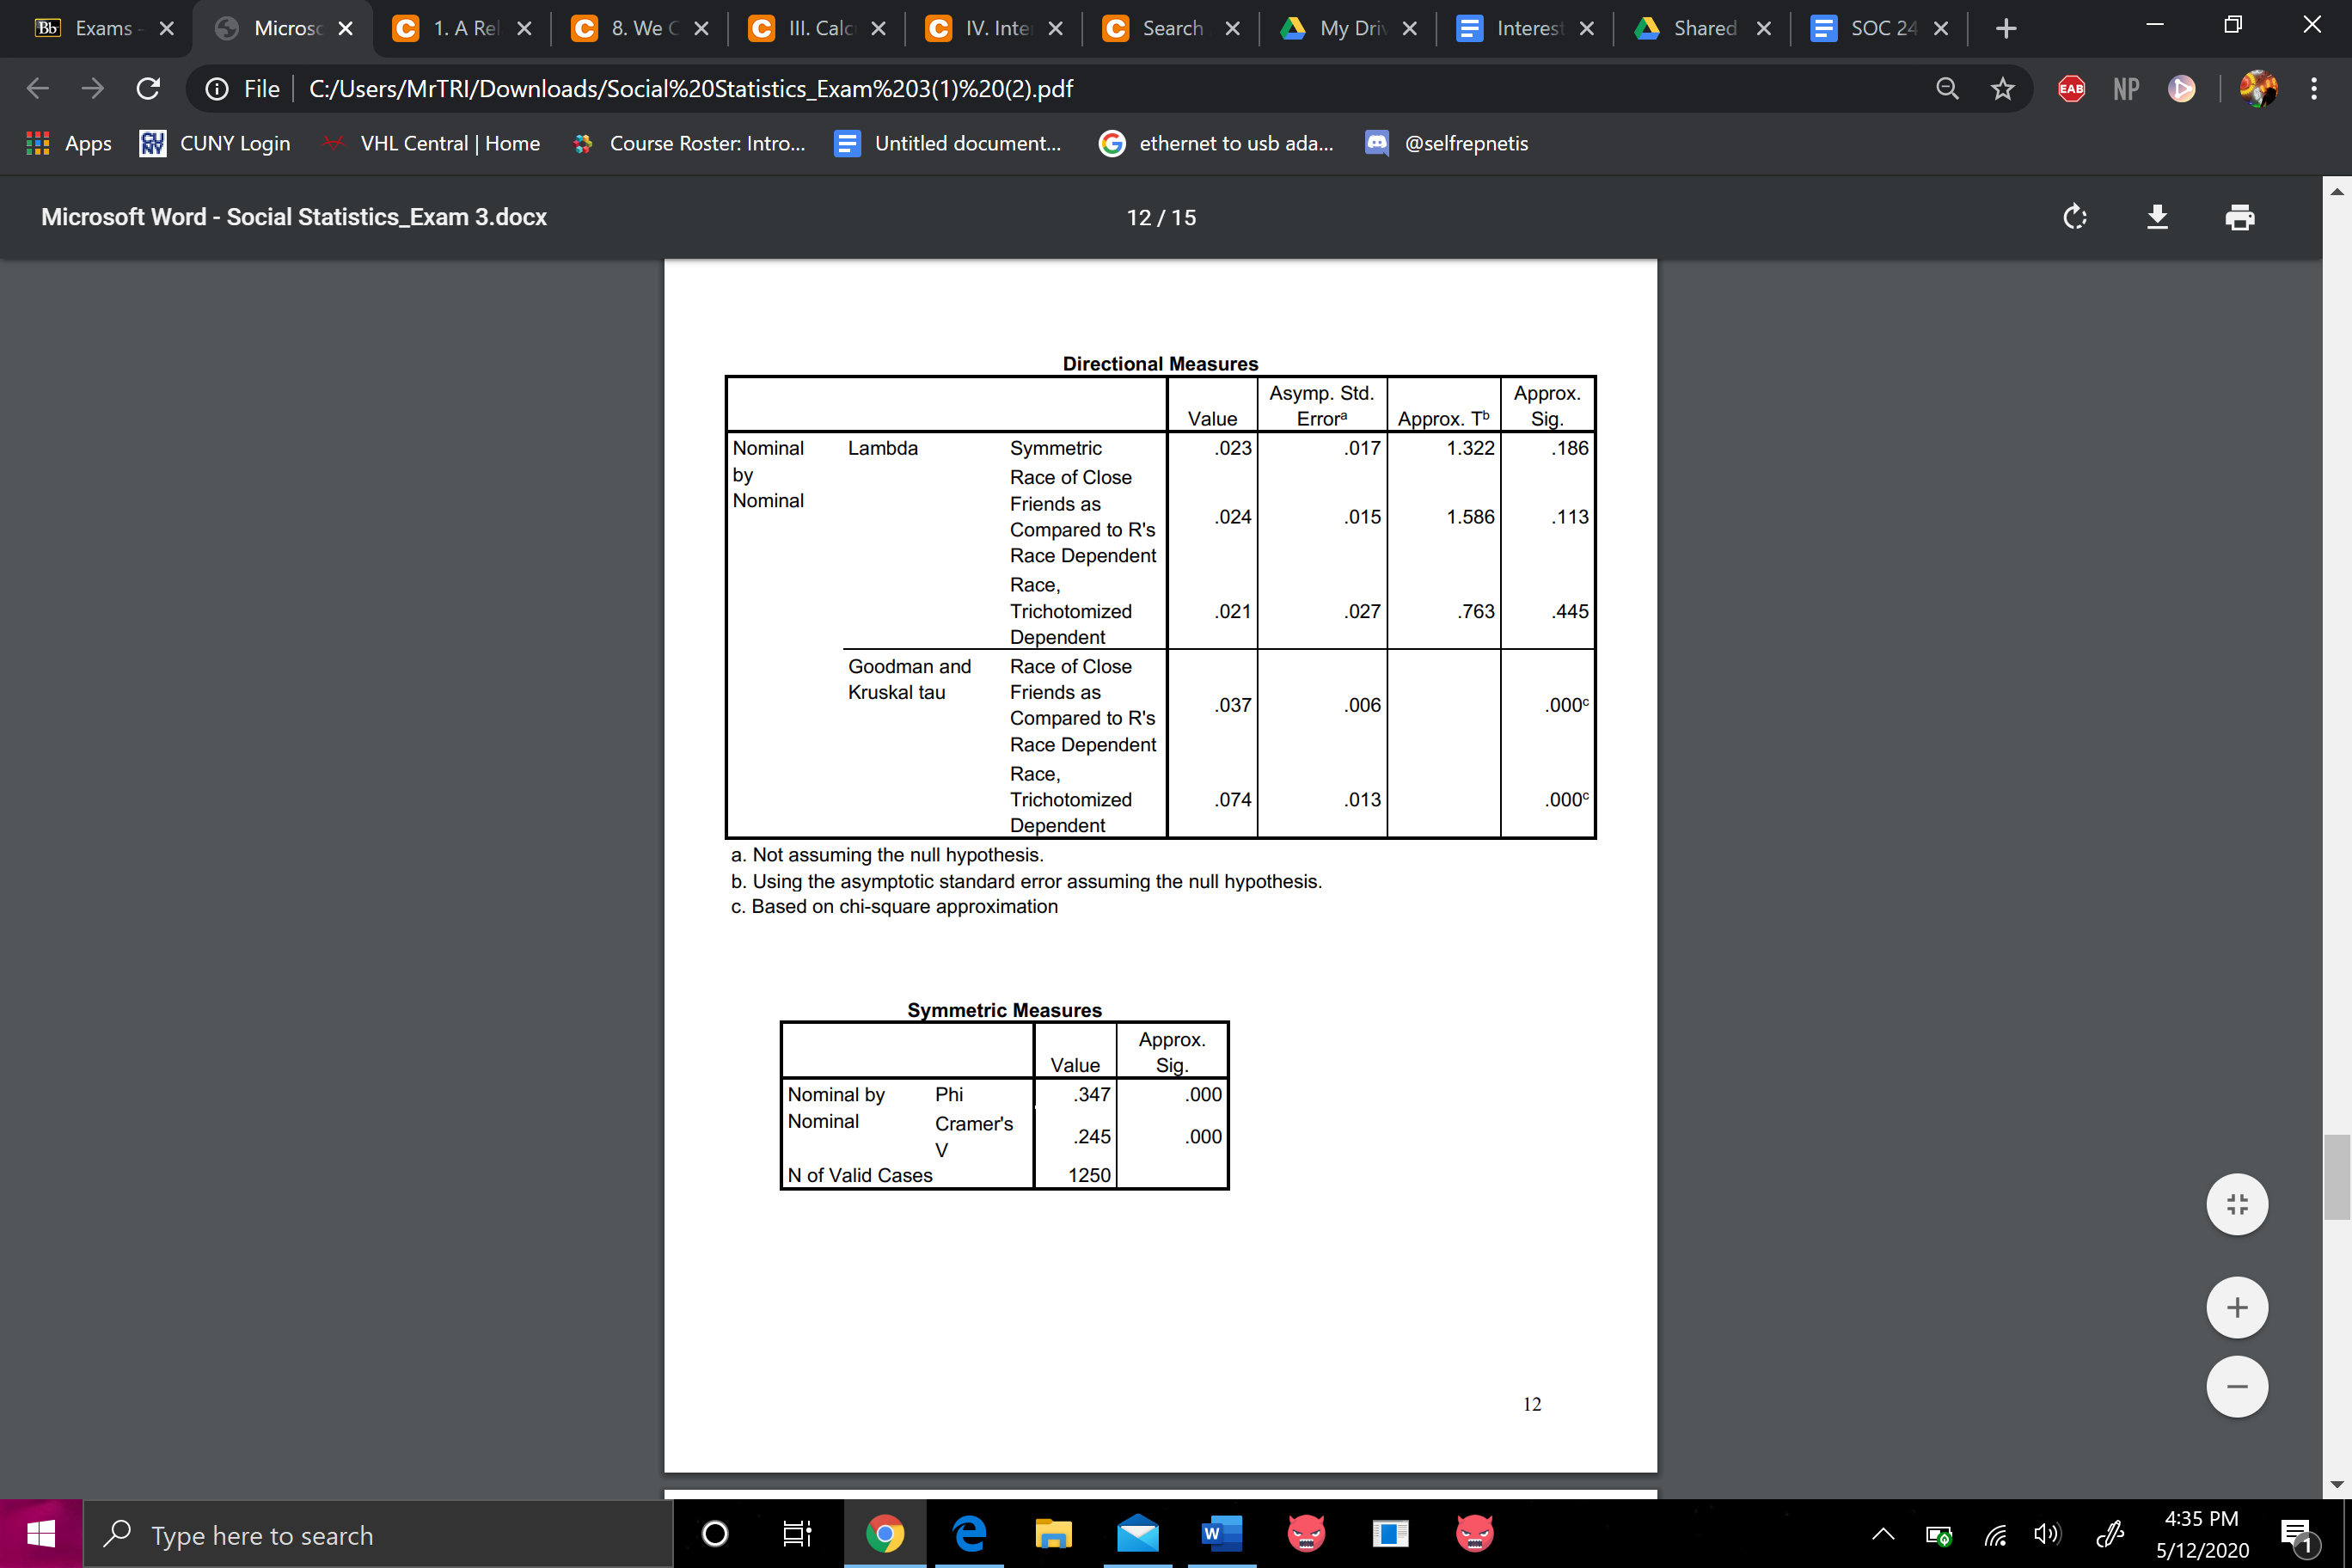
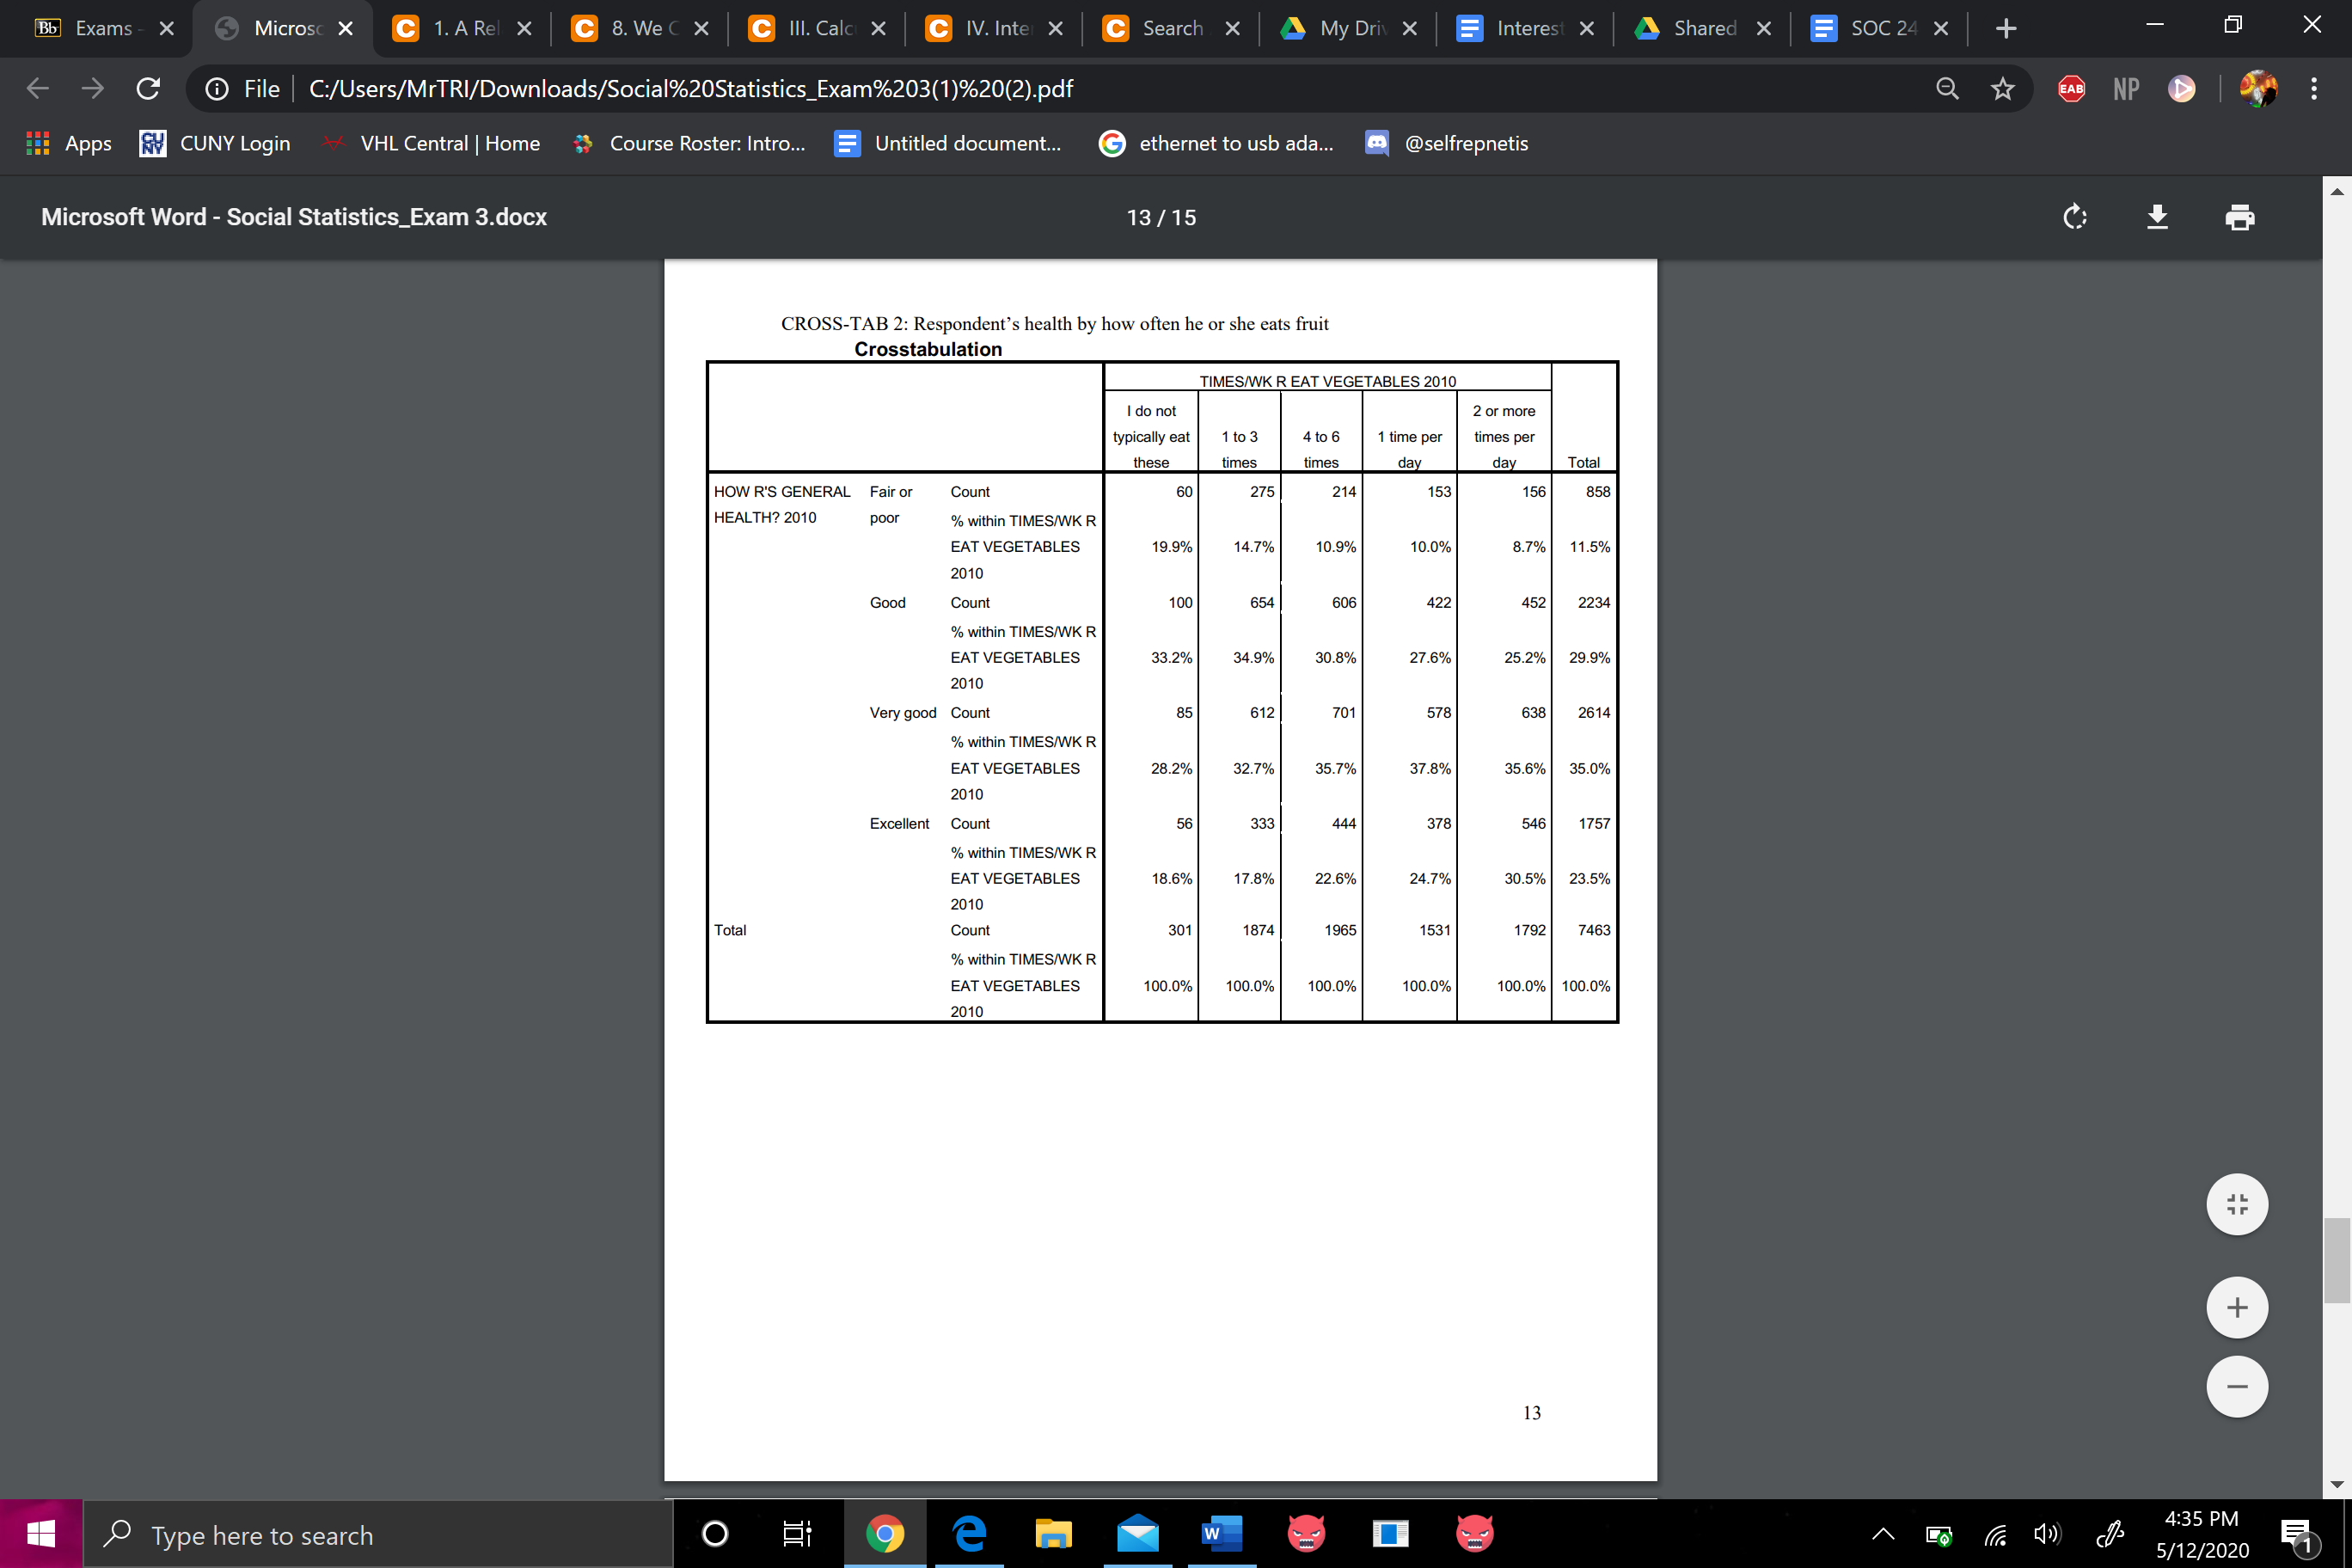
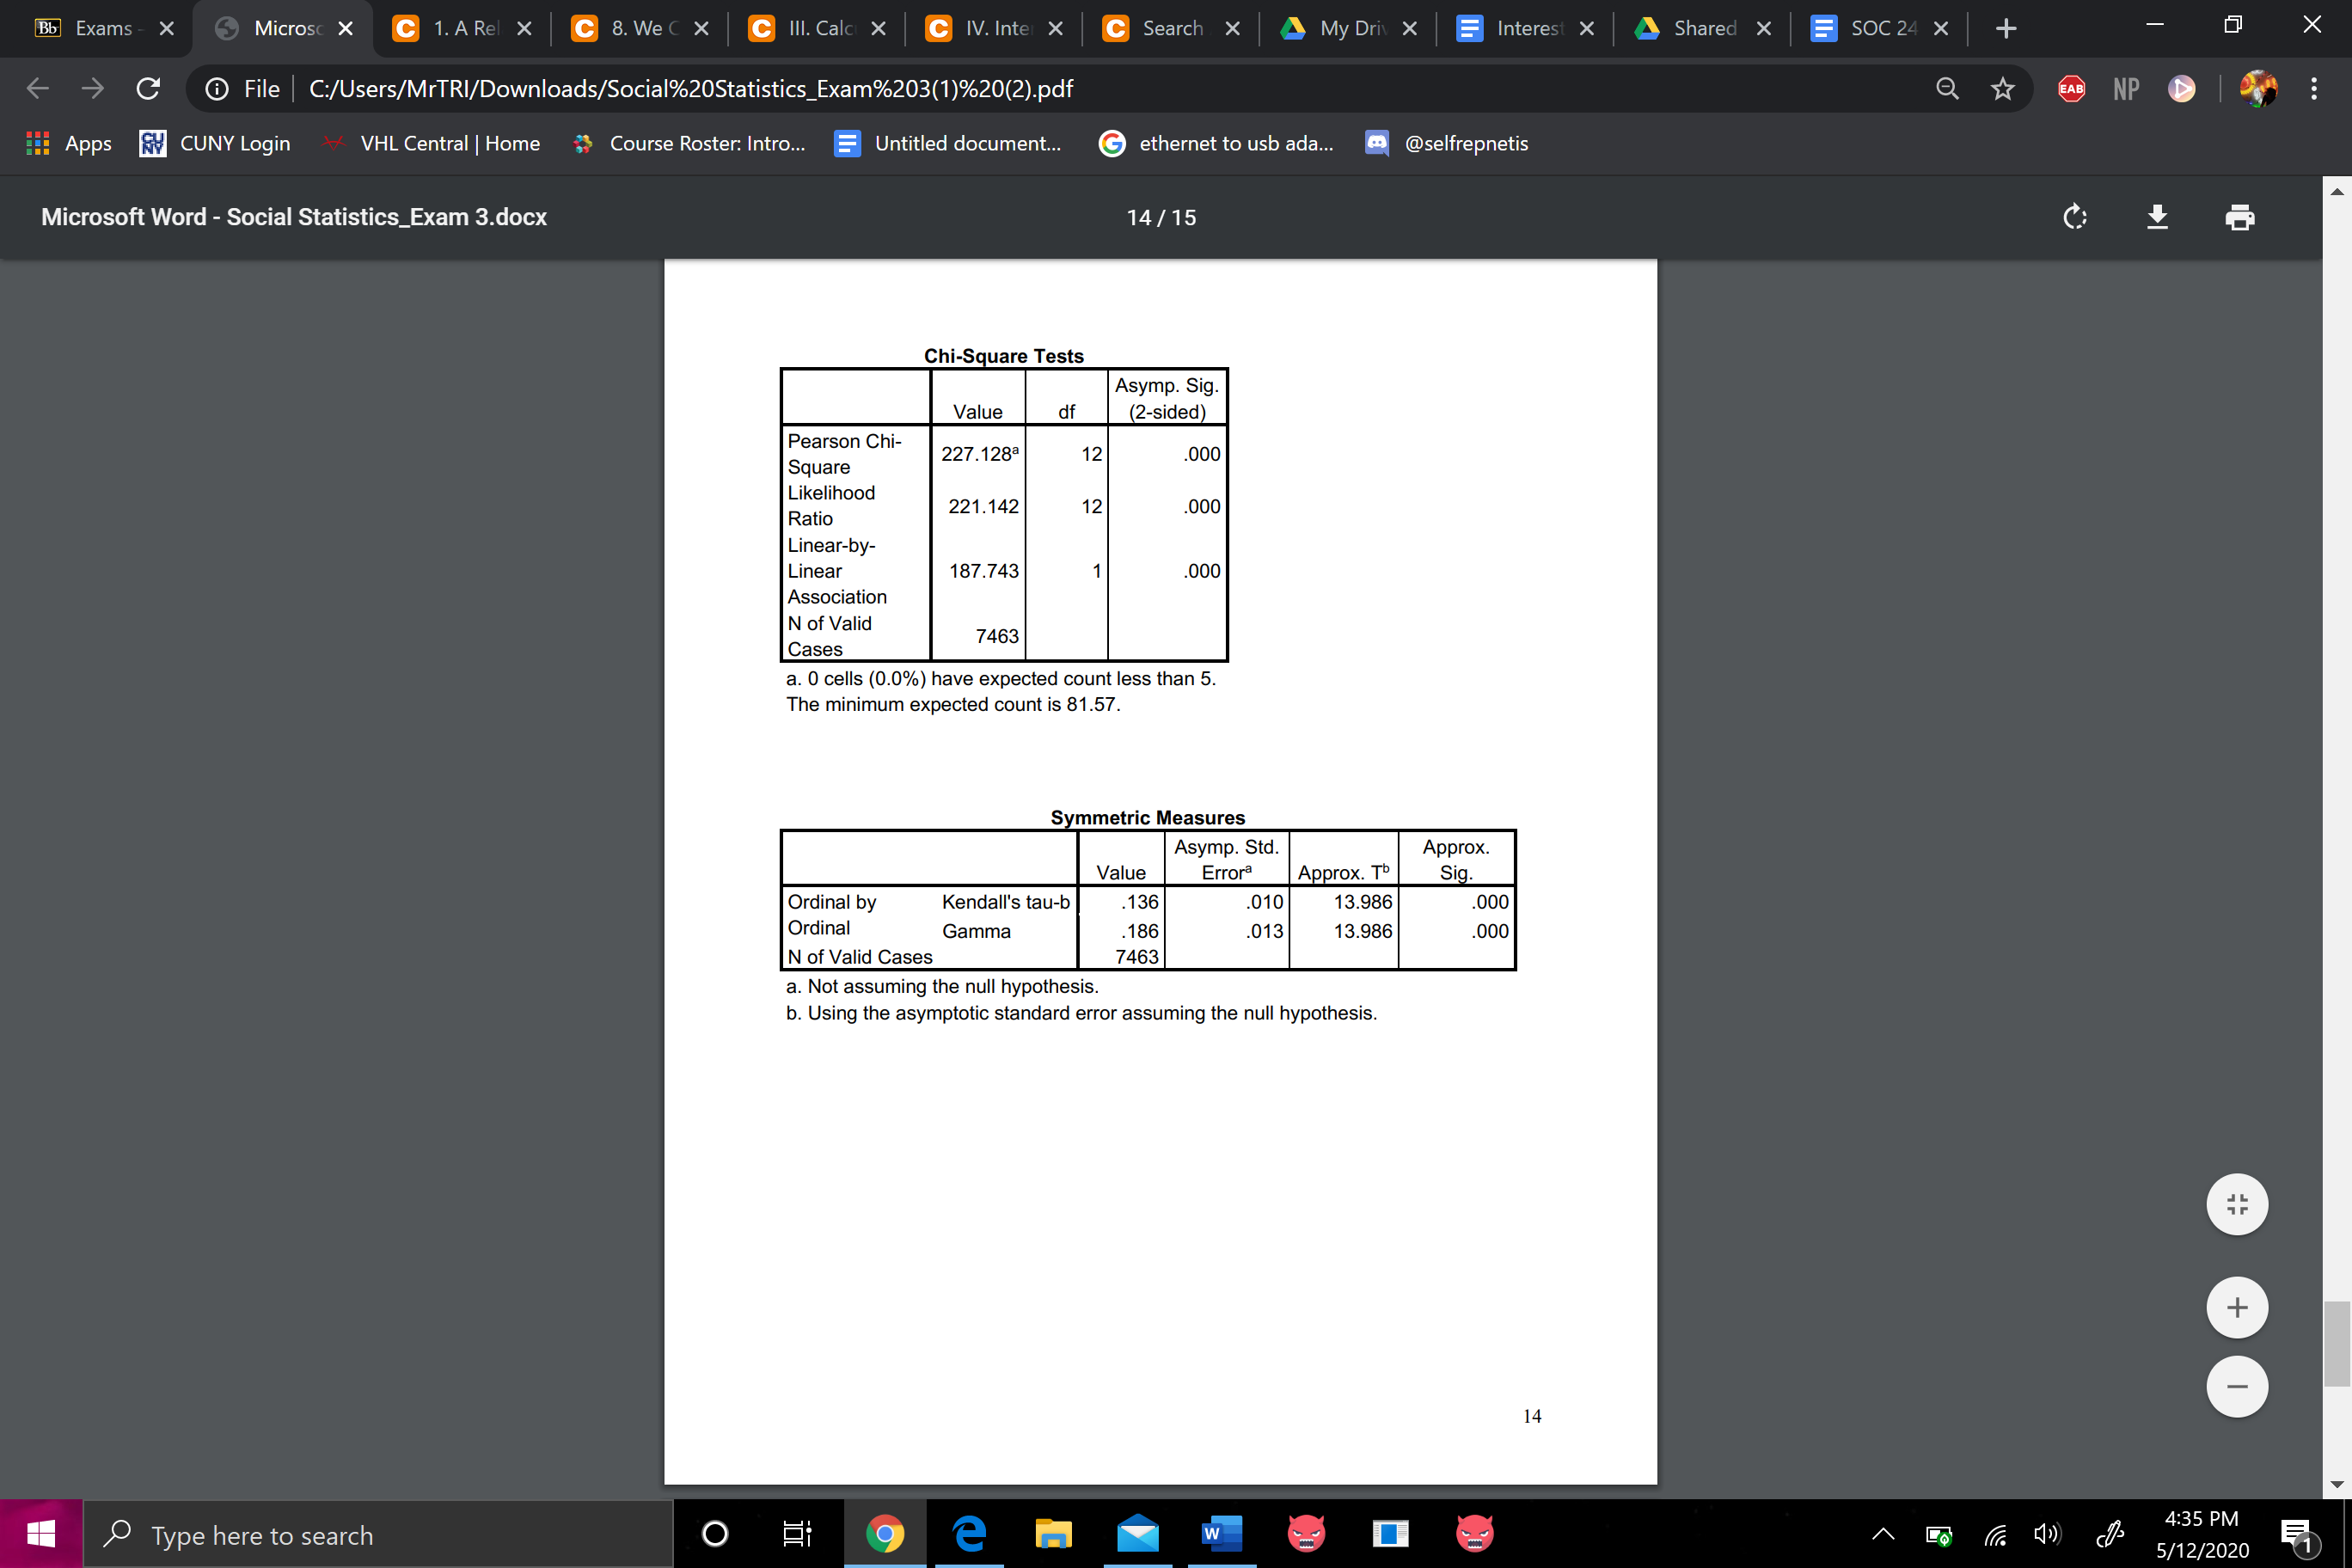
Bb Exams - X Microsc X C 1. A Rel X C 8. We C X C Ill. Calc X C IV. Intel X C Search X My Driv X Interest X Shared X SOC 24 X + X @ File | C:/Users/MrTRI/Downloads/Social%20Statistics_Exam%203(1)%20(2).pdf EAB NP i Apps RV CUNY Login n VHL Central | Home Course Roster: Intro.. Untitled document.. G ethernet to usb ada... @selfrepnetis Microsoft Word - Social Statistics_Exam 3.docx 15 / 15 CORRELATION: Grade point average and scale of friends' use of cigarettes, alcohol, and marijuana Correlations Grade Point Average frienduse Grade Point Average Pearson Correlation .160" Sig. (2-tailed N 1400 1280 frienduse Pearson Correlation . 160' Sig. (2-tailed) .000 1280 1300 ** Correlation is significant at the 0.01 level (2-tailed). REGRESSION: Grade point average by scale of friends' use of cigarettes, alcohol, and marijuana Model Summary Adjusted R Std. Error of the Model R R Square Square Estimate .160a .026 .025 -66810 a. Predictors: (Constant), frienduse Coefficients Standardized Unstandardized Coefficients Coefficients Model B Std. Error Beta Sig. (Constant) .481 57.350 000 frienduse .021 -.160 -5.796 .00 a. Dependent Variable: Grade Point Average + 15 Type here to search O gemw cl)s 4:35 PM 5/12/2020 EBb Exams - X Microsc X C 1. A Rel X C 8. We C X C Ill. Calc X C IV. Intel X C Search X My Driv X Interest X Shared X SOC 24 X + X @ File | C:/Users/MrTRI/Downloads/Social%20Statistics_Exam%203(1)%20(2).pdf EAB NP D i Apps RV CUNY Login n VHL Central | Home Course Roster: Intro... Untitled document.. G ethernet to usb ada.. @selfrepnetis Microsoft Word - Social Statistics_Exam 3.docx 9 / 15 2. Interpret your output from cross-tab 2 a. Is the relationship between these variables significant? (2 point) b. Identify and interpret gamma (2 points) c. Identify and interpret Kendall's tau-b (2 points) 3. Interpret your output from the correlation analysis a. Identify and interpret r, the correlation coefficient (2 points) + Type here to search O gemw O cl)s 4:34 PM 5/12/2020 EBb Exams - X Microsc X C 1. A Rel X C 8. We C X C Ill. Calc X C IV. Intel X C Search X My Driv X Interest X Shared X SOC 24 X + X @ File | C:/Users/MrTRI/Downloads/Social%20Statistics_Exam%203(1)%20(2).pdf EAB NP D Apps SV CUNY Login VHL Central | Home Course Roster: Intro... Untitled document.. G ethernet to usb ada... @selfrepnetis Microsoft Word - Social Statistics_Exam 3.docx 10 / 15 4. Interpret your output from the regression analysis a. Identify the independent and dependent variables (1 points) b. Identify and interpret 12 (2 points) c. Identify and interpret the y-intercept (2 points) d. Identify and interpret the slope (2 points) e . Write the regression equation using the information available from this analysis (3 points) + Type here to search O W O cl)s 4:34 PM 5/12/2020 EBb Exams - X Microsc X C 1. A Rel X C 8. We C X C Ill. Calc X C IV. Intel X C Search X My Driv X Interest X Shared X SOC 24 X + X @ File | C:/Users/MrTRI/Downloads/Social%20Statistics_Exam%203(1)%20(2).pdf EAB NP i Apps RV CUNY Login n VHL Central | Home Course Roster: Intro... _ Untitled document.. G ethernet to usb ada.. @selfrepnetis Microsoft Word - Social Statistics_Exam 3.docx 11 / 15 CROSS-TAB 1: Race of close friends by race/ethnicity Race of Close Friends as Compared to R's Race * Race, Trichotomized Crosstabulation Race, Trichotomized BLACK: WHITE: HISPANIC: (1) (2) (3 Total Race of Close ALMOST/ALL Count 77 459 43 $79 Friends as MINE:(1) Compared to R's o within Race, 53.1 21.4% Race Trichotomized 41.6% 46.3% MOST MINE:(2) Count 4 248 46 334 o within Race, Trichotomized 21.60 28.7% 22.9% 26.7% 1/2 MINE:(3) Count 41 106 200 % within Race, Trichotomized 22.2 12.3% 26.4% 16.0% MOST/ALL Count 27 51 59 137 OTHER:(4) % within Race, Trichotomized 14.6% 5.9% 29.4% 11.09 Total Count 185 864 201 1250 % within Race, Trichotomized 100.0% 100.0% 100.0% 100.09 Chi-Square Tests Asymp. Sig. Value df (2-sided) Pearson Chi- Square 150.510a 6 .000 Likelihood Ratio 139.22 6 000 Linear-by- Linear 30.448 000 Association N of Valid Cases 1250 a. 0 cells (0.0%) have expected count less than 5 The minimum expected count is 20.28 + 11 Type here to search O 9 w cl)s 4:35 PM 5/12/2020 EBb Exams - X Microsc X C 1. A Rel X C 8. We C X C Ill. Calc X C IV. Intel X C Search X My Driv X Interest X Shared X SOC 24 X + X @ File | C:/Users/MrTRI/Downloads/Social%20Statistics_Exam%203(1)%20(2).pdf EAB NP i Apps RV CUNY Login n * VHL Central | Home ) Course Roster: Intro... _ Untitled document.. G ethernet to usb ada... @selfrepnetis Microsoft Word - Social Statistics_Exam 3.docx 12 / 15 Directional Measures Asymp. Std. Approx. Value Errora Approx. To Sig Nominal Lambda Symmetric 023 017 1.322 186 by Race of Close Nominal Friends as Compared to R's 024 015 1.586 .113 Race Dependent Race Trichotomized 021 027 763 445 Dependent Goodman and Race of Close Kruskal tau Friends as Compared to R's 037 006 000c Race Dependent Race, Trichotomized .074 013 .000c Dependent a. Not assuming the null hypothesis. b. Using the asymptotic standard error assuming the null hypothesis. c. Based on chi-square approximation Symmetric Measures Approx. Value Sig. Nominal by Phi 347 000 Nominal Cramer's 245 .000 N of Valid Cases 1250 + 12 Type here to search O W O cl)s 4:35 PM 5/12/2020 EBb Exams - X Microsc X C 1. A Rel X C 8. We C X C Ill. Calc X C IV. Intel X C Search X My Driv X Interest X Shared X SOC 24 X + X @ File | C:/Users/MrTRI/Downloads/Social%20Statistics_Exam%203(1)%20(2).pdf EAB NP i Apps RV CUNY Login n VHL Central | Home ) Course Roster: Intro.. _ Untitled document.. G ethernet to usb ada... @selfrepnetis Microsoft Word - Social Statistics_Exam 3.docx 13 / 15 CROSS-TAB 2: Respondent's health by how often he or she eats fruit Crosstabulation TIMES/WK R EAT VEGETABLES 2010 I do not 2 or more typically eat 1 to 3 4 to 6 1 time per times per these times times day day Total HOW R'S GENERAL Fair or Count 275 214 153 156 858 HEALTH? 2010 poor % within TIMES/WK R EAT VEGETABLES 19.9% 14.7% 10.9% 10.0% 8.7% 11.5% 2010 Good Count 100 654 606 22 152 2234 % within TIMES/WK R EAT VEGETABLES 33.2% 34.9% 30.8% 27.6% 25.2% 29.9% 2010 Very good Count 85 512 701 578 638 2614 % within TIMES/WK R EAT VEGETABLES 28.2% 32.7% 35.7% 37.8% 35.6% 35.0% 2010 Excellent Count 56 333 144 278 546 1757 % within TIMES/WK R EAT VEGETABLES 18.6% 17.8% 22.6% 24.7% 30.5% 23.5% 2010 Total Count 301 1874 1965 1531 1792 7463 % within TIMES/WK R EAT VEGETABLES 100.0% 100.0% 100.0% 100.0% 0 100.0% 2010 + 13 Type here to search O 9 w O cl)s 4:35 PM 5/12/2020 EBb Exams - X Microsc X C 1. A Rel X C 8. We C X C Ill. Calc X C IV. Intel X C Search X My Driv X Interest X Shared X SOC 24 X + X @ File | C:/Users/MrTRI/Downloads/Social%20Statistics_Exam%203(1)%20(2).pdf EAB NP i Apps RV CUNY Login n VHL Central | Home ) Course Roster: Intro... Untitled document.. G ethernet to usb ada... @selfrepnetis Microsoft Word - Social Statistics_Exam 3.docx 14 / 15 Chi-Square Tests Asymp. Sig. Value df (2-sided) Pearson Chi- Square 227.128a 12 .000 Likelihood Ratio 221.142 12 .000 Linear-by- Linear 187.743 000 Association N of Valid Cases 7463 a. 0 cells (0.0%) have expected count less than 5. The minimum expected count is 81.57. Symmetric Measures Asymp. Std. Approx. Value Errora Approx. To Sig. Ordinal by Kendall's tau-b 136 .010 13.986 000 Ordinal Gamma . 186 .013 13.986 .000 N of Valid Cases 7463 a. Not assuming the null hypothesis. b. Using the asymptotic standard error assuming the null hypothesis. + 14 Type here to search O 9 em W O cl)s 4:35 PM 5/12/2020 E
Step by Step Solution
There are 3 Steps involved in it

Get step-by-step solutions from verified subject matter experts