Question: I have a pdf instructions for SPSS assignment and I already have the answer but I want to make sure that my answer is correct
I have a pdf instructions for SPSS assignment and I already have the answer but I want to make sure that my answer is correct based on the instructions.
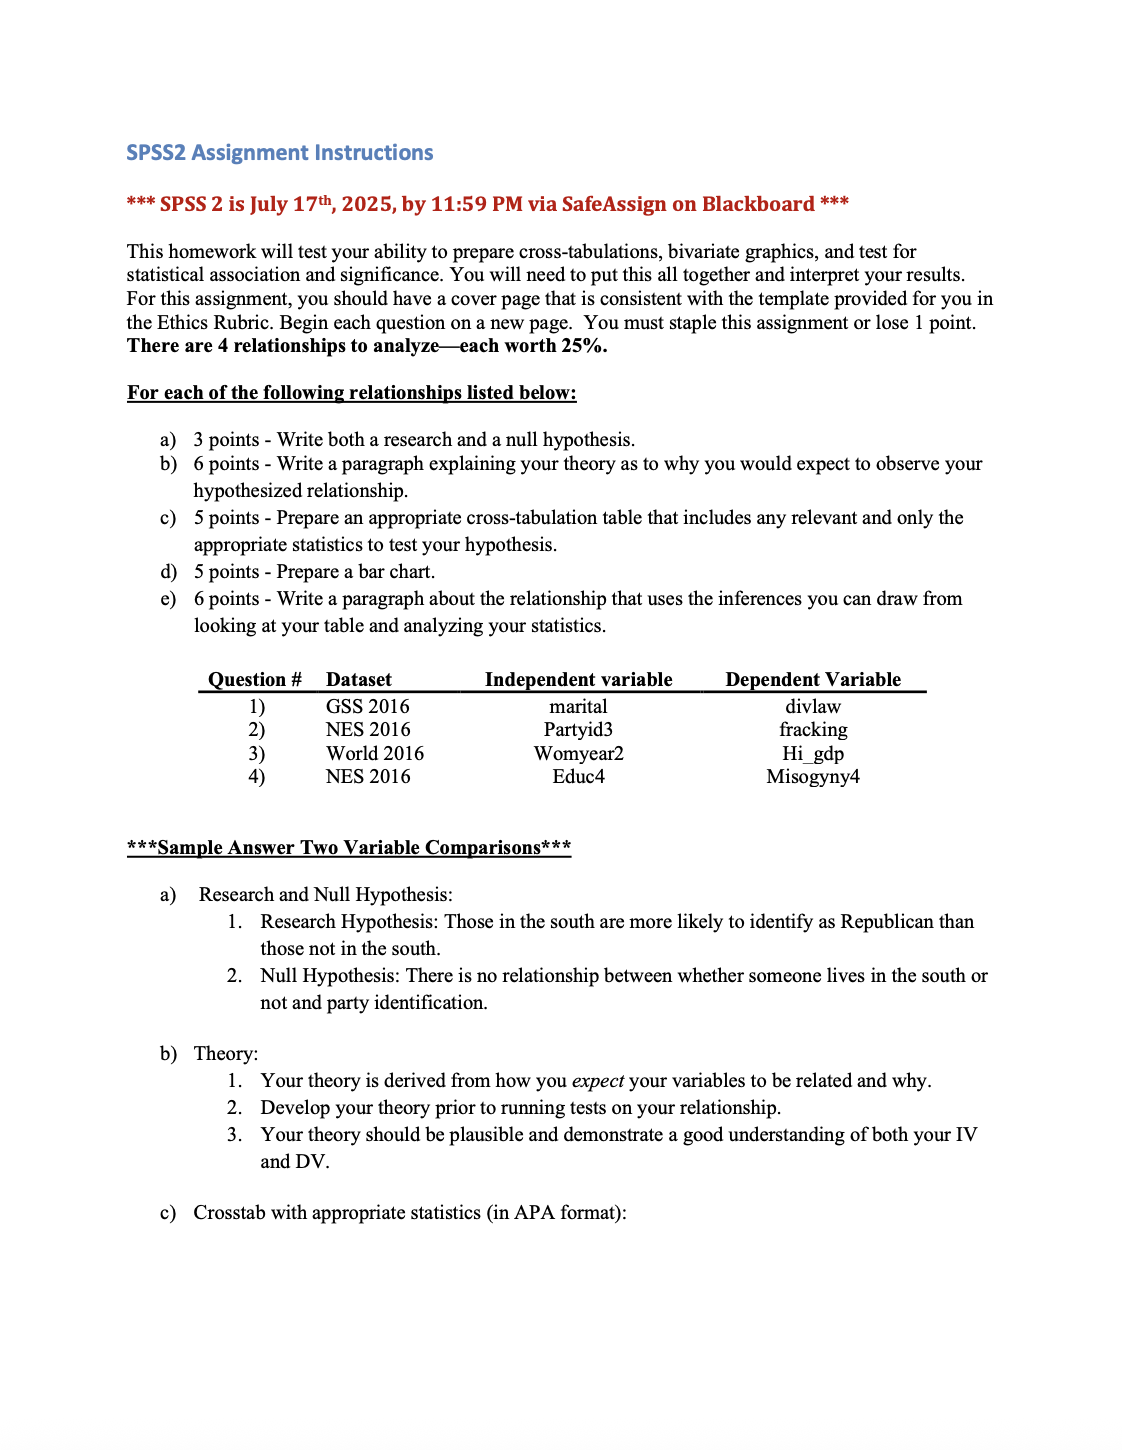
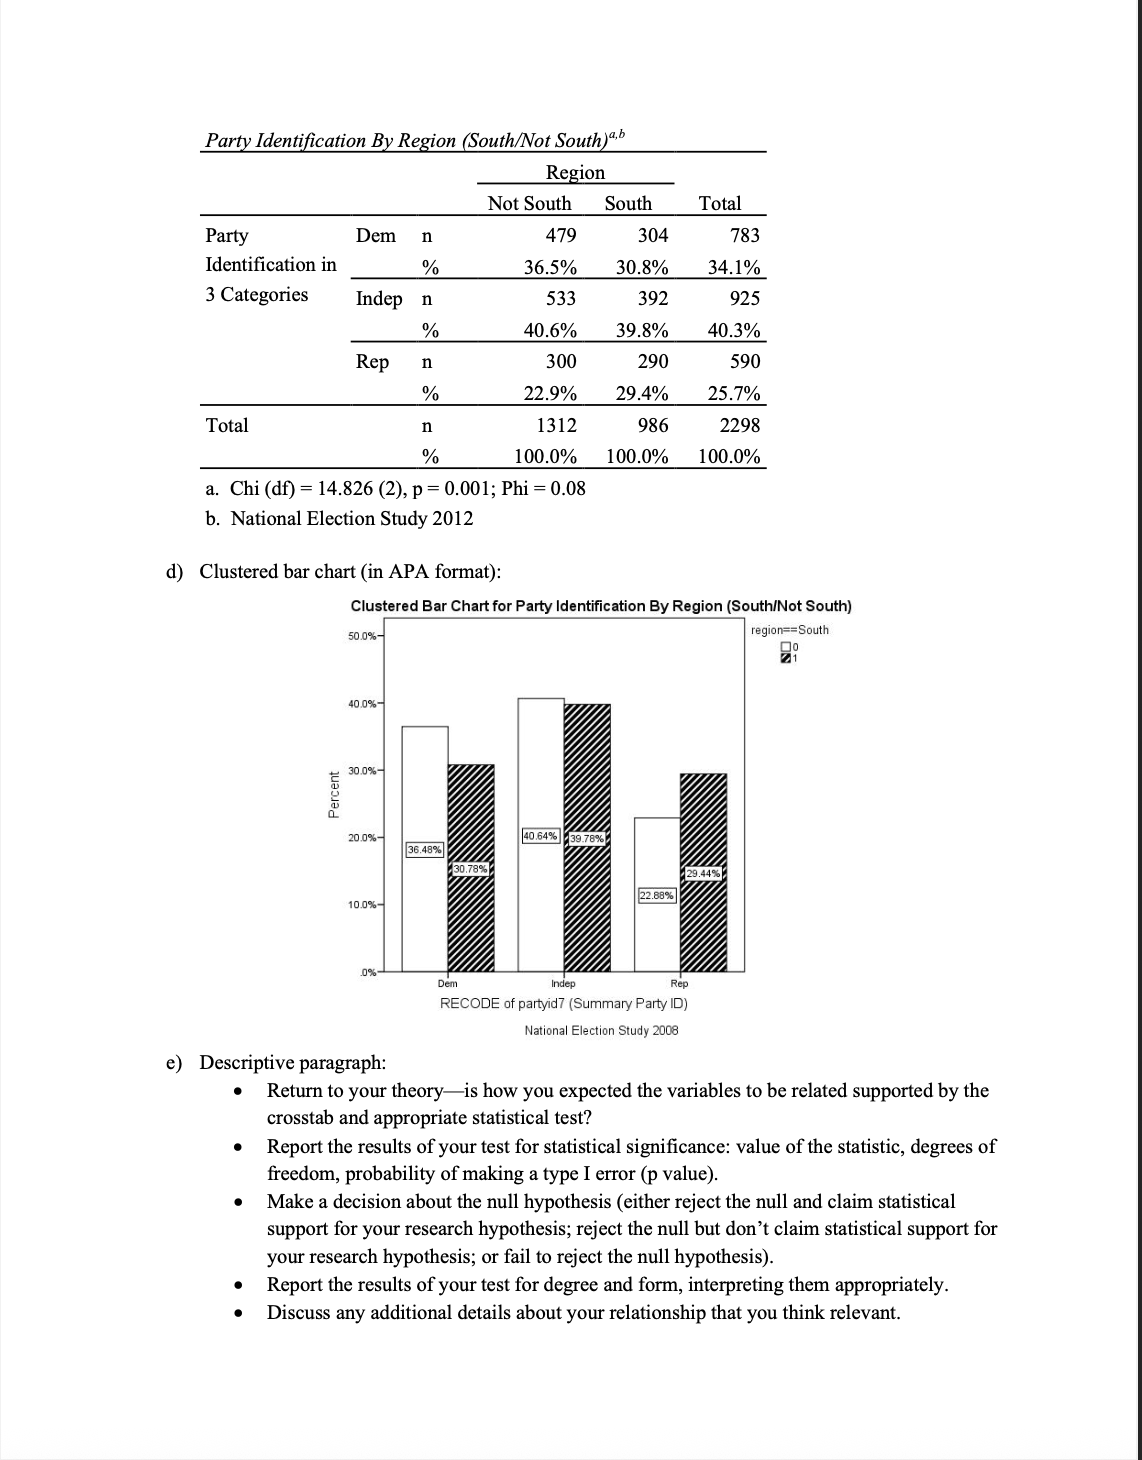
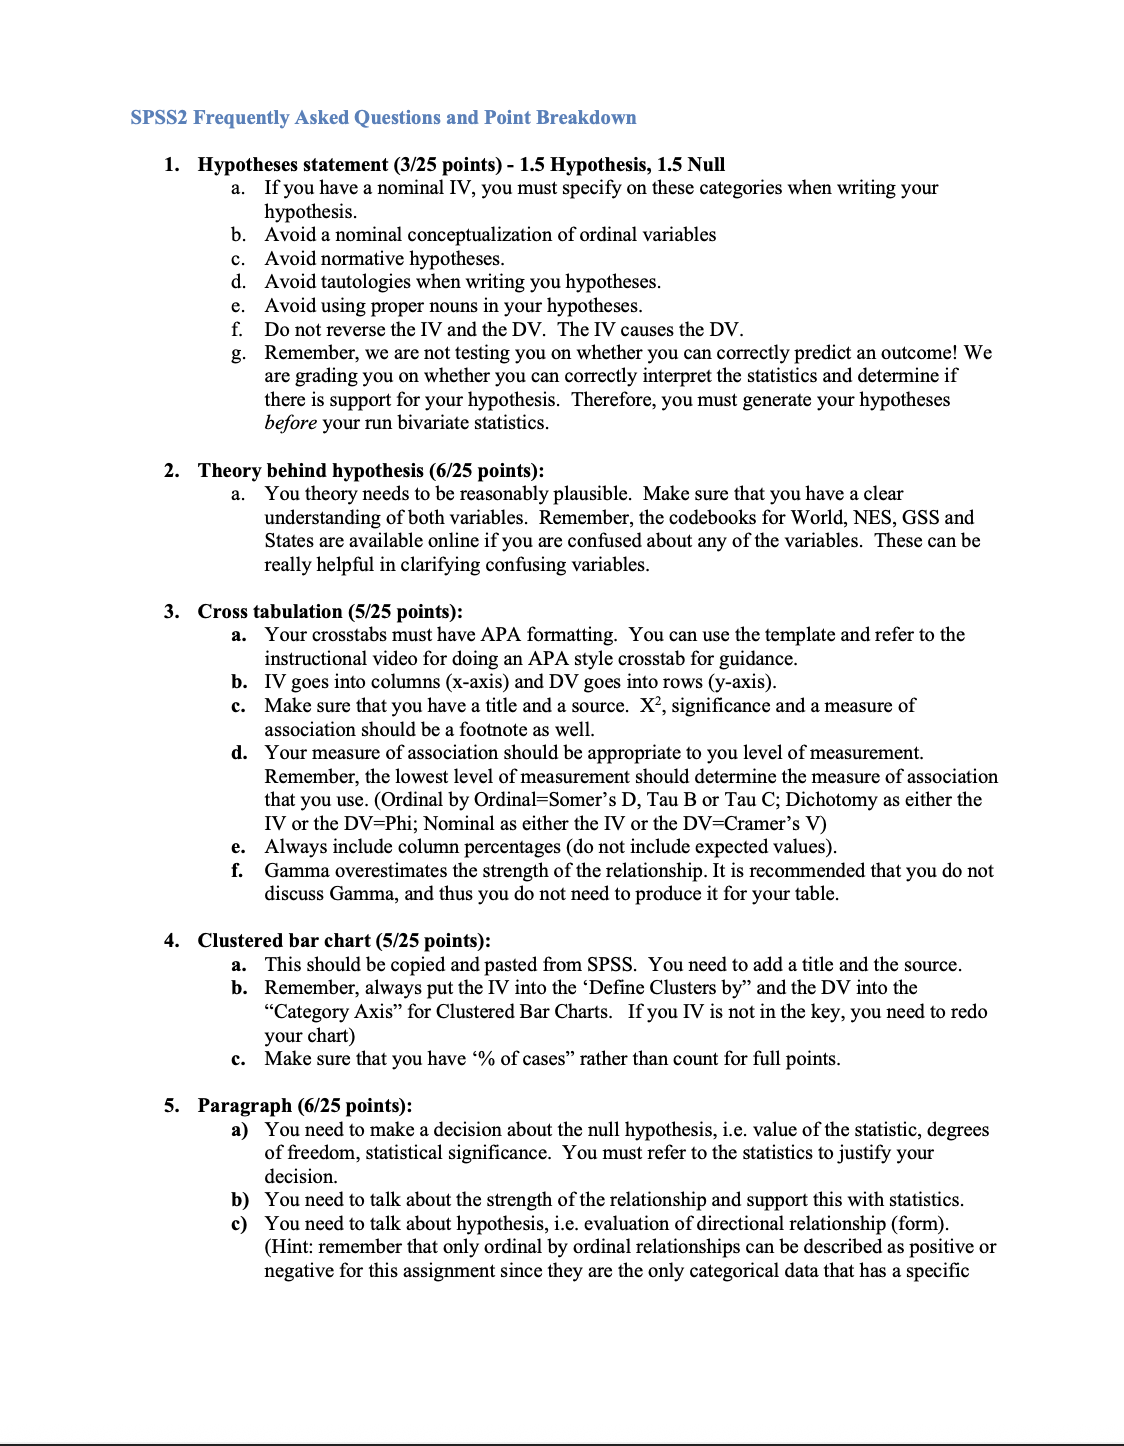
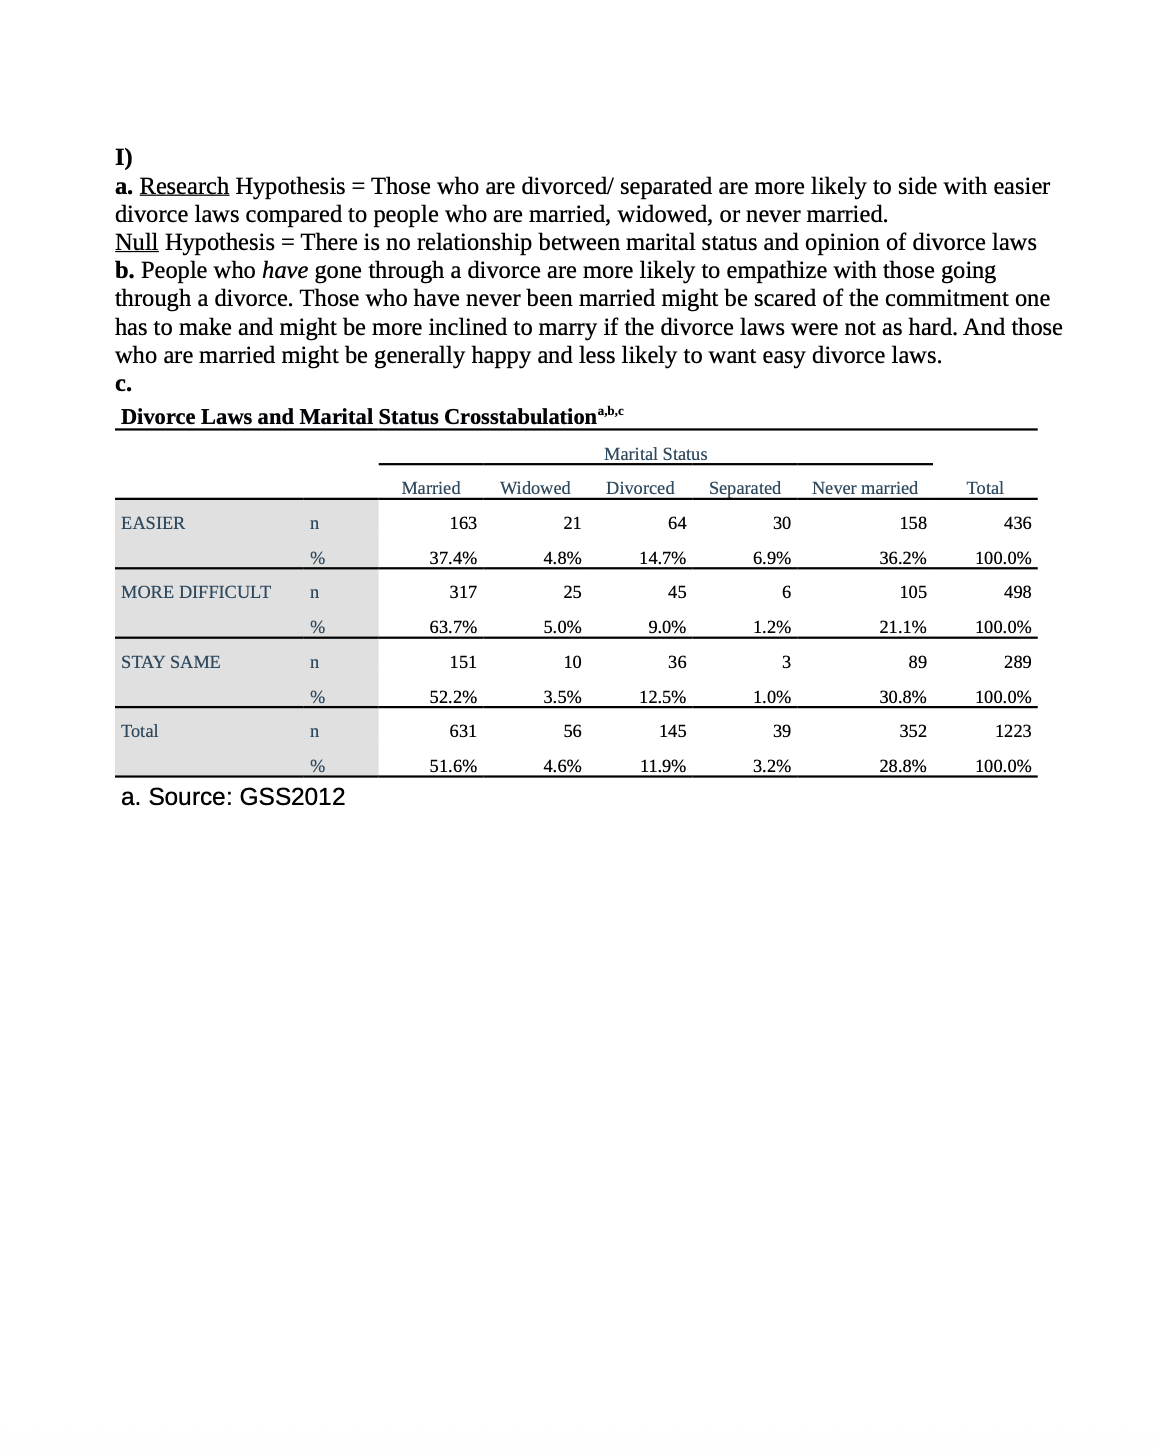
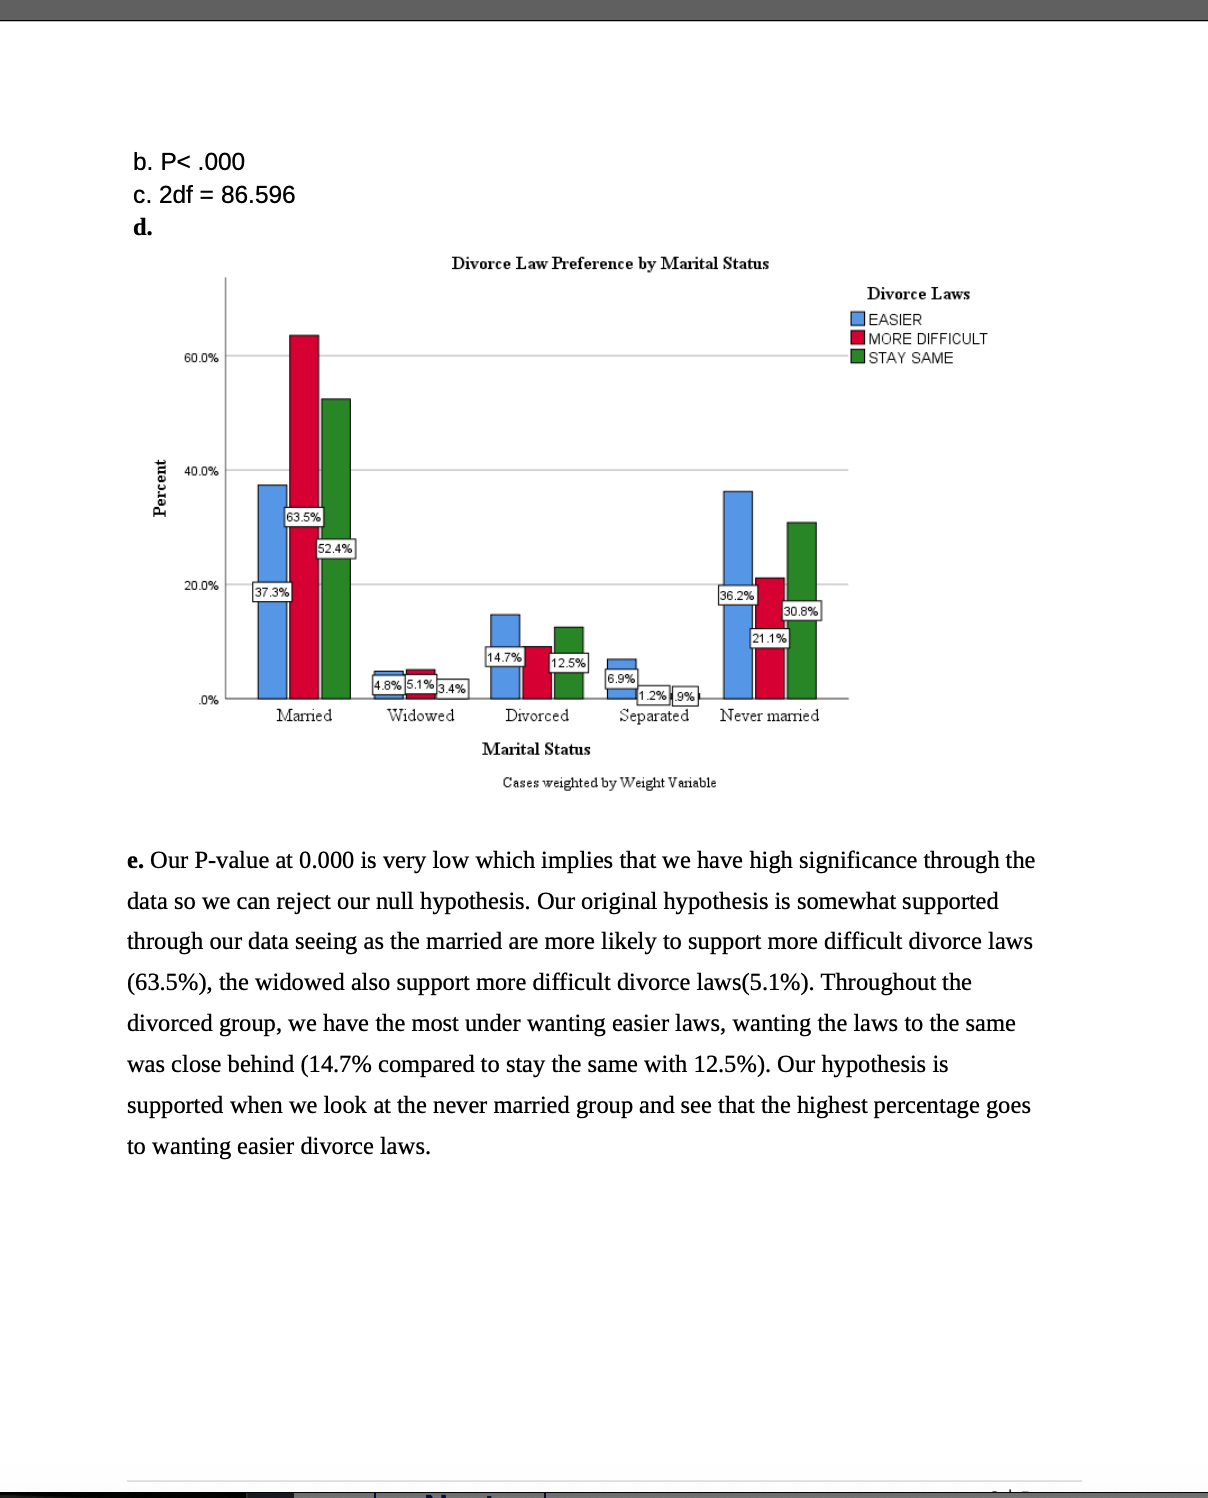
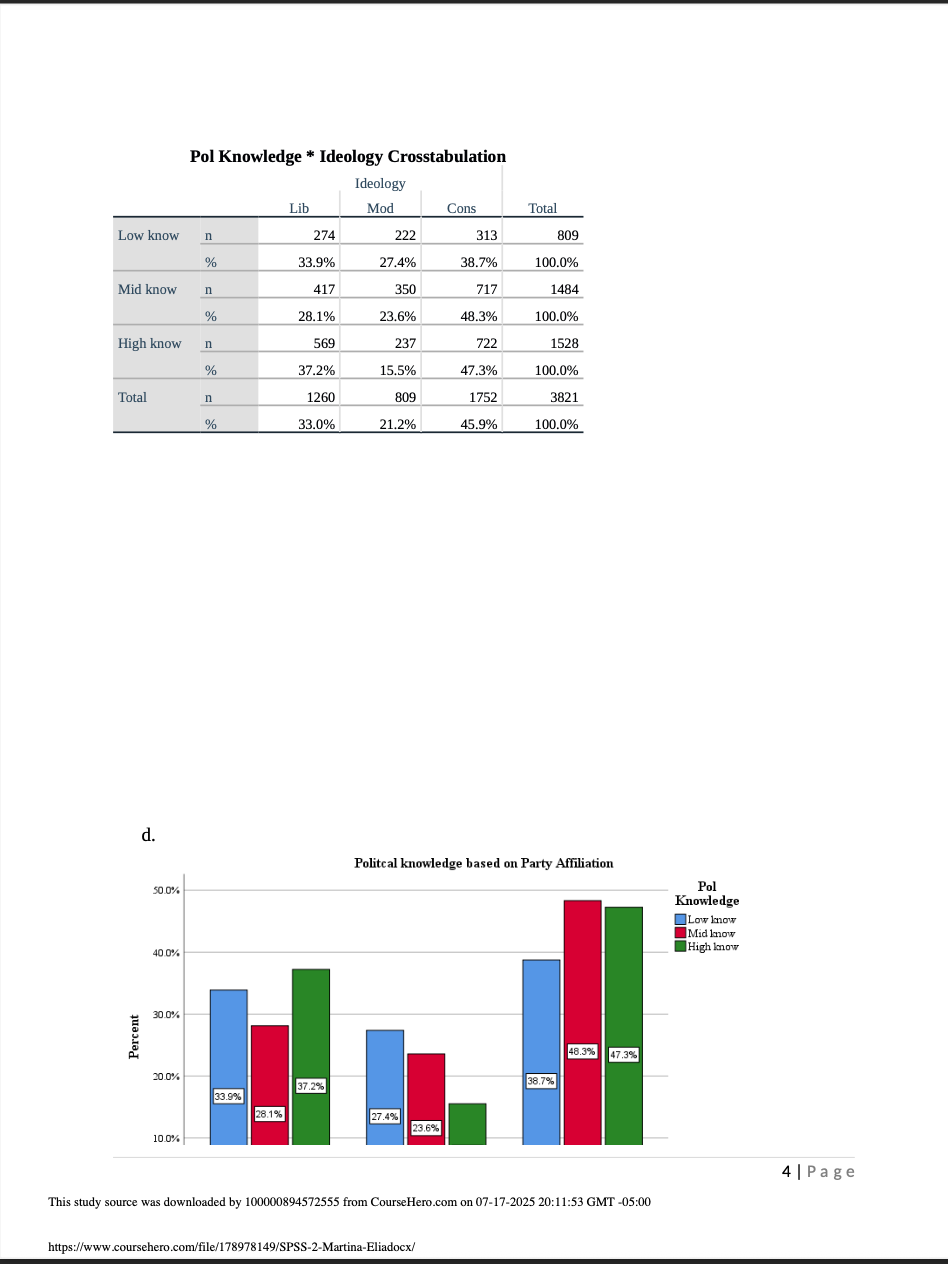
SPSS2 Assignment Instructions *** SPSS 2 is July 17, 2025, by 11:59 PM via SafeAssign on Blackboard *** This homework will test your ability to prepare cross-tabulations, bivariate graphics, and test for statistical association and significance. You will need to put this all together and interpret your results. For this assignment, you should have a cover page that is consistent with the template provided for you in the Ethics Rubric. Begin each question on a new page. You must staple this assignment or lose 1 point. There are 4 relationships to analyzeeach worth 25%. For each of the following relationships listed below: a) 3 points - Write both a research and a null hypothesis. b) 6 points - Write a paragraph explaining your theory as to why you would expect to observe your hypothesized relationship. c) 5 points - Prepare an appropriate cross-tabulation table that includes any relevant and only the appropriate statistics to test your hypothesis. d) 5 points - Prepare a bar chart. e) 6 points - Write a paragraph about the relationship that uses the inferences you can draw from looking at your table and analyzing your statistics. uestion# Dataset Independent variable Dependent Variable 1) GSS 2016 marital divlaw 2) NES 2016 Partyid3 fracking 3) World 2016 Womyear2 Hi_gdp 4) NES 2016 Educ4 Misogyny4 ***Sample Answer Two Variable Comparisons*** a) Research and Null Hypothesis: 1. Research Hypothesis: Those in the south are more likely to identify as Republican than those not in the south. 2. Null Hypothesis: There is no relationship between whether someone lives in the south or not and party identification. b) Theory: 1. Your theory is derived from how you expect your variables to be related and why. 2. Develop your theory prior to running tests on your relationship. 3. Your theory should be plausible and demonstrate a good understanding of both your IV and DV. c) Crosstab with appropriate statistics (in APA format): Party Identification By Region (South/Not South ee Region Not South South Total Party Dem n 479 304 783 Identification in % 36.5% 30.8% 34.1% 3 Categories Indep n 533 392 925 % 40.6% _ 39.8% _ 40.3% Rep n 300 290 590 % 22.9% 29.4% 25.7% Total n 1312 986 2298 % 100.0% 100.0% 100.0% a. Chi (df) = 14.826 (2), p = 0.001; Phi = 0.08 b. National Election Study 2012 d) Clustered bar chart (in APA format): Clustered Bar Chart for Party Identification By Region (South/Not South) 50.0% region==South Qo 4! 40.0% 30.0% Percent 10.0% Indep / Rep RECCODE of partyid7 (Summary Party ID) National Election Study 2008 e) Descriptive paragraph: e Return to your theoryis how you expected the variables to be related supported by the crosstab and appropriate statistical test? e Report the results of your test for statistical significance: value of the statistic, degrees of freedom, probability of making a type I error (p value). e Make a decision about the null hypothesis (either reject the null and claim statistical support for your research hypothesis; reject the null but don't claim statistical support for your research hypothesis; or fail to reject the null hypothesis). e Report the results of your test for degree and form, interpreting them appropriately. e Discuss any additional details about your relationship that you think relevant. SPSS2 Frequently Asked Questions and Point Breakdown 1. Hypotheses statement (3/25 points) - 1.5 Hypothesis, 1.5 Null a. Timoenaoe ht If you have a nominal IV, you must specify on these categories when writing your hypothesis. Avoid a nominal conceptualization of ordinal variables Avoid normative hypotheses. Avoid tautologies when writing you hypotheses. Avoid using proper nouns in your hypotheses. Do not reverse the IV and the DV. The IV causes the DV. Remember, we are not testing you on whether you can correctly predict an outcome! We are grading you on whether you can correctly interpret the statistics and determine if there is support for your hypothesis. Therefore, you must generate your hypotheses before your run bivariate statistics. - Theory behind hypothesis (6/25 points): a. You theory needs to be reasonably plausible. Make sure that you have a clear understanding of both variables. Remember, the codebooks for World, NES, GSS and States are available online if you are confused about any of the variables. These can be really helpful in clarifying confusing variables. 3. Cross tabulation (5/25 points): a. La] * Your crosstabs must have APA formatting. You can use the template and refer to the instructional video for doing an APA style crosstab for guidance. IV goes into columns (x-axis) and DV goes into rows (y-axis). Make sure that you have a title and a source. X?, significance and a measure of association should be a footnote as well. Your measure of association should be appropriate to you level of measurement. Remember, the lowest level of measurement should determine the measure of association that you use. (Ordinal by Ordinal=Somer's D, Tau B or Tau C; Dichotomy as either the IV or the DV=Phi; Nominal as either the IV or the DV=Cramer's V) Always include column percentages (do not include expected values). Gamma overestimates the strength of the relationship. It is recommended that you do not discuss Gamma, and thus you do not need to produce it for your table. 4. Clustered bar chart (5/25 points): a. b. c. wm This should be copied and pasted from SPSS. You need to add a title and the source. Remember, always put the IV into the 'Define Clusters by\" and the DV into the \"Category Axis\" for Clustered Bar Charts. If you IV is not in the key, you need to redo your chart) Make sure that you have '% of cases\" rather than count for full points. . Paragraph (6/25 points): a) You need to make a decision about the null hypothesis, i.e. value of the statistic, degrees of freedom, statistical significance. You must refer to the statistics to justify your decision. b) You need to talk about the strength of the relationship and support this with statistics. c) You need to talk about hypothesis, i.e. evaluation of directional relationship (form). (Hint: remember that only ordinal by ordinal relationships can be described as positive or negative for this assignment since they are the only categorical data that has a specific 1) a. Research Hypothesis = Those who are divorced/ separated are more likely to side with easier divorce laws compared to people who are married, widowed, or never married. Null Hypothesis = There is no relationship between marital status and opinion of divorce laws b. People who have gone through a divorce are more likely to empathize with those going through a divorce. Those who have never been married might be scared of the commitment one has to make and might be more inclined to marry if the divorce laws were not as hard. And those who are married might be generally happy and less likely to want easy divorce laws. Cc. Divorce Laws and Marital Status Crosstabulation\"* Marital Status Married Widowed Divorced Separated Never married Total EASIER n 163 21 64 30 158 436 % 37.4% 4.8% 14.7% 6.9% 36.2% 100.0% MORE DIFFICULT n 317 25 45 6 105 498 % 63.7% 5.0% 9.0% 1.2% 21.1% 100.0% STAY SAME n 151 10 36 3 89 289 % 52.2% 3.5% 12.5% 1.0% 30.8% 100.0% Total n 631 56 145 39 352 1223 % 51.6% 4.6% 11.9% 3.2% 28.8% 100.0% a. Source: GSS2012 b. P<.000 c. d. divorce law preference by marital status laws easier more difficult stay same percent married widowed divorced separated never cases weighted weight variable e. our p-value at is very low which implies that we have high significance through the data so can reject null hypothesis. original hypothesis somewhat supported seeing as are likely to support also throughout group most under wanting was close behind compared with when look and see highest percentage goes laws.pol knowledge ideology crosstabulation lib mod cons total know mid n d politcal based on party affiliation pol page this study source downloaded from coursehero.com gmt https:>
Step by Step Solution
There are 3 Steps involved in it
1 Expert Approved Answer
Step: 1 Unlock
Question Has Been Solved by an Expert!
Get step-by-step solutions from verified subject matter experts
Step: 2 Unlock
Step: 3 Unlock
Students Have Also Explored These Related Mathematics Questions!