

Question: 2. Linear Regression & Problem Exploration The least-squares regression line is of the form y = ax + b, where a and b are defined

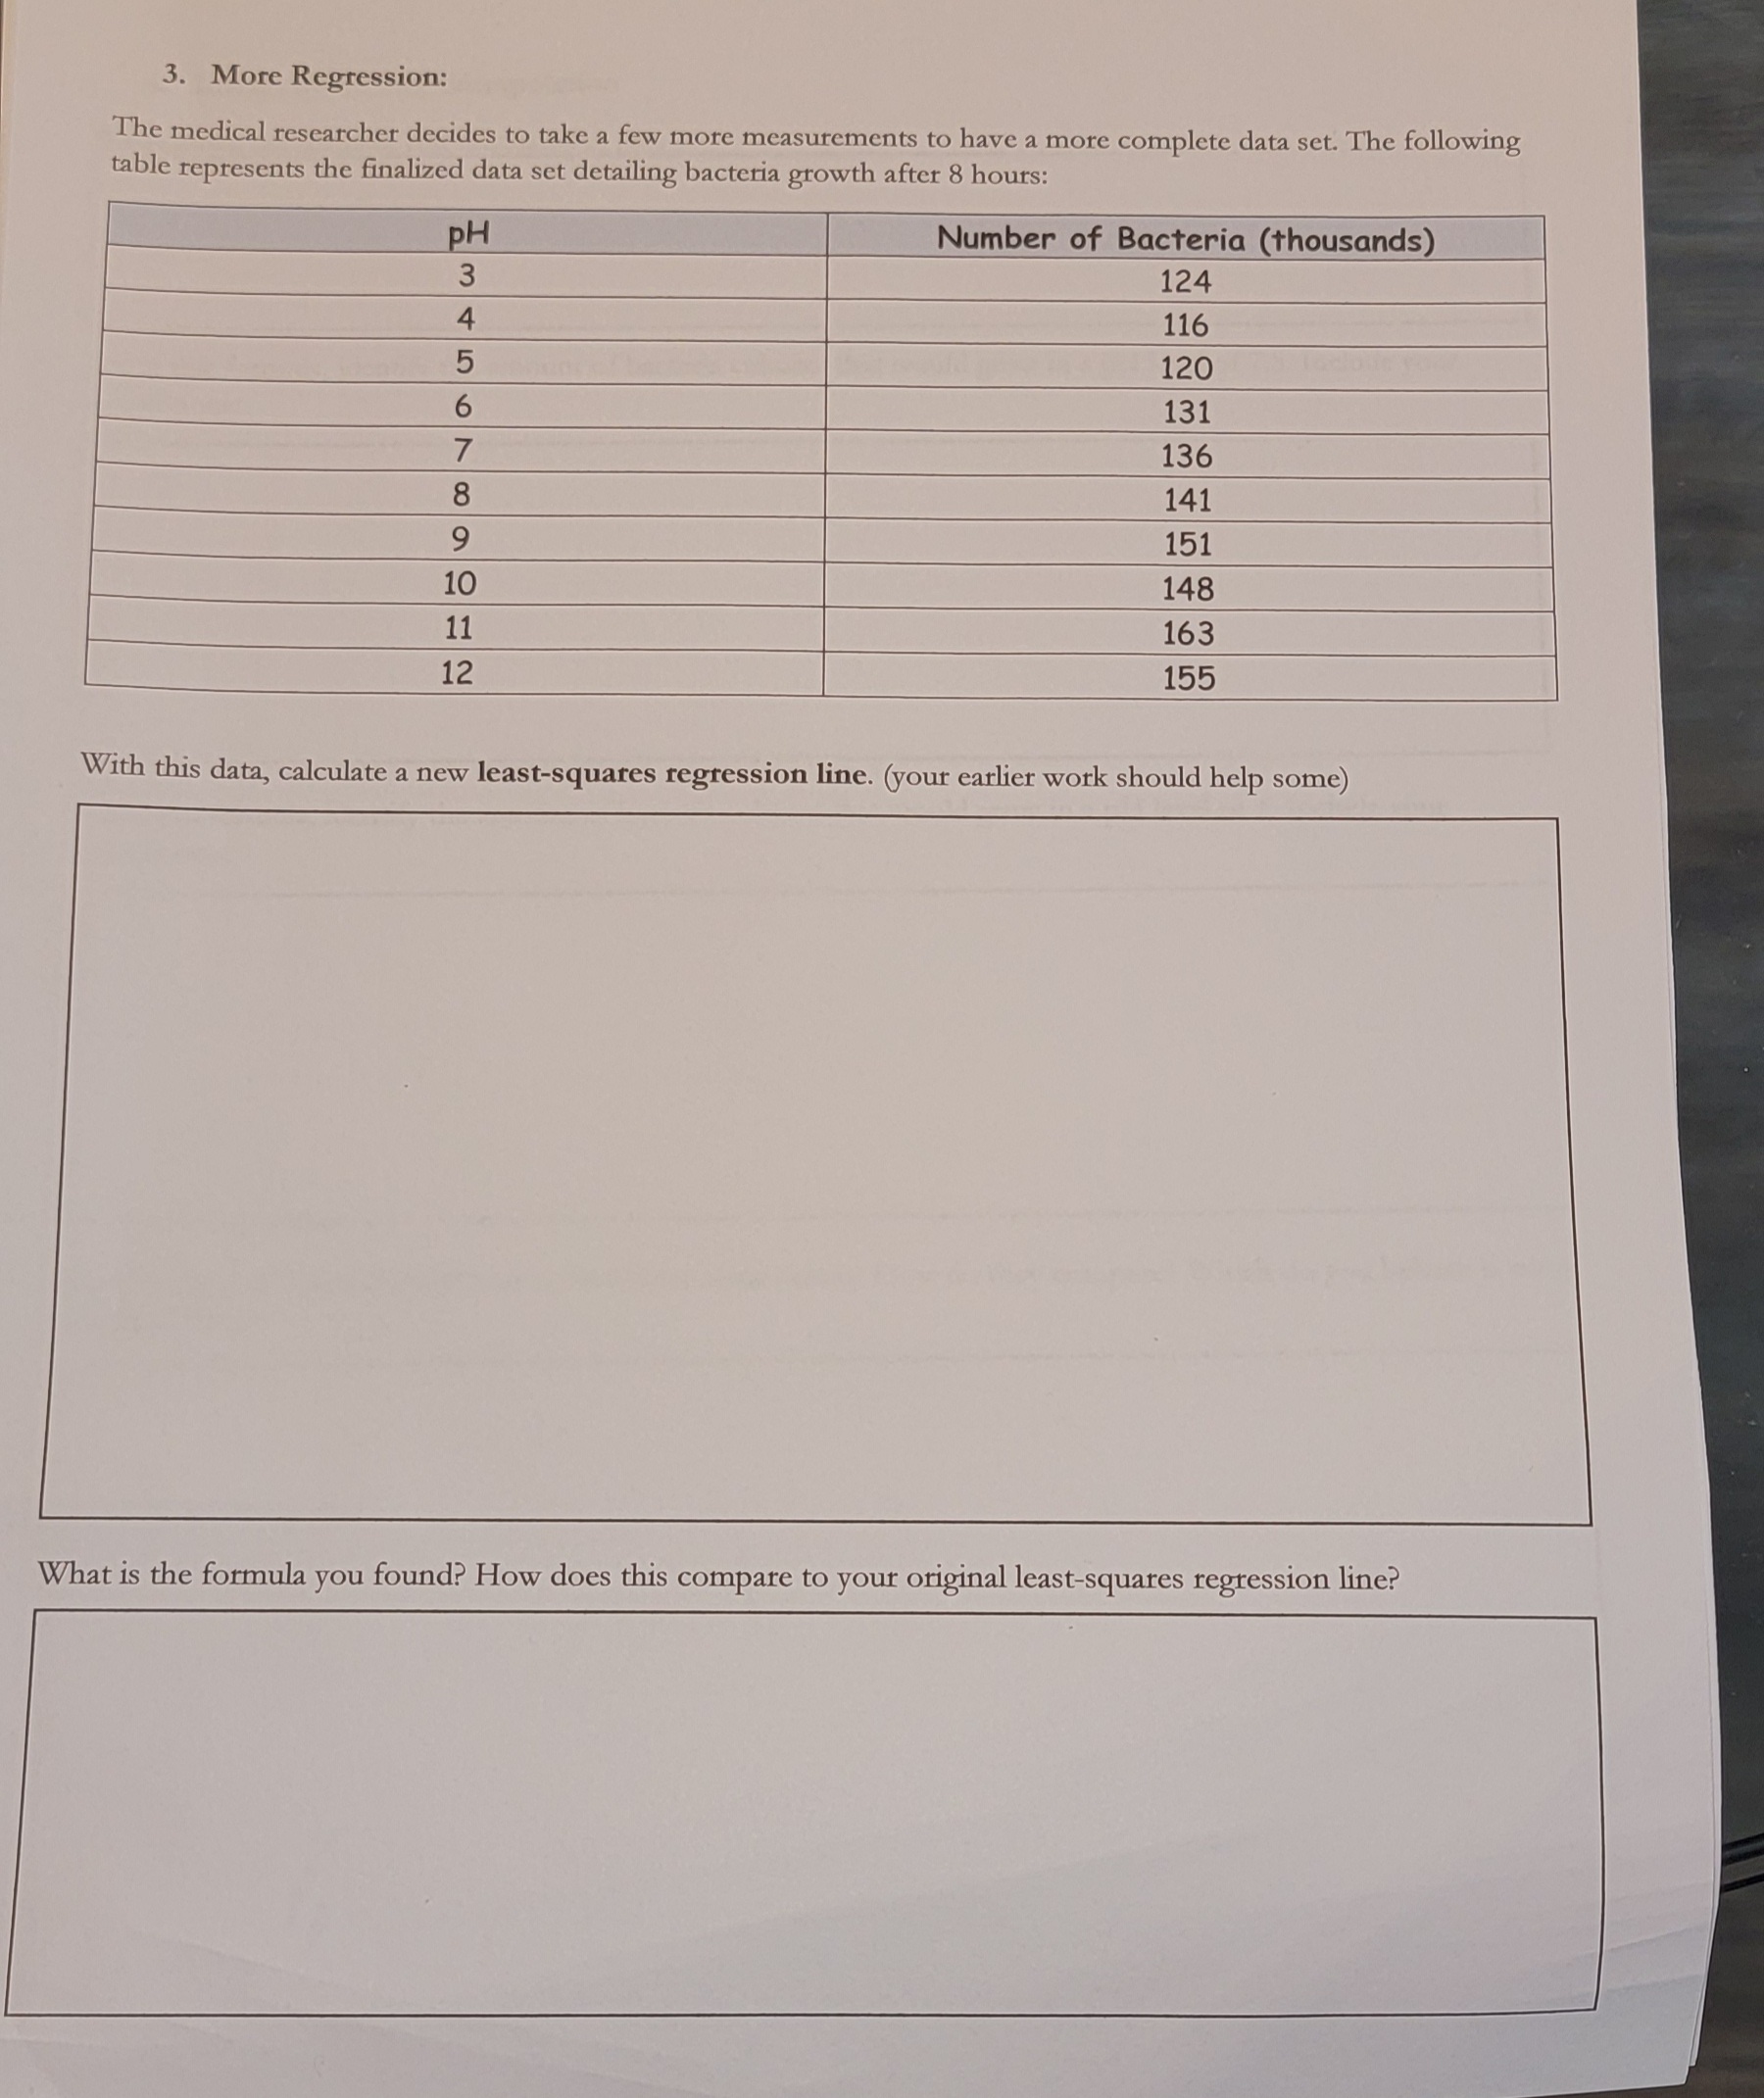

2. Linear Regression & Problem Exploration The least-squares regression line is of the form y = ax + b, where a and b are defined as follows: a = - n ( Exy ) - ( Ex ) ( Zy) n (Ex2 ) - (Ex) 2 b = ( Ey) (Ex2) - (Ex) (Exy) n(Exz) - (Ex)2 Here, n represents the number of data points given. With the data provided, find the least-squares regression line. 9 = nExy - ( Ex) ( zy ) n ( E x 2 ) - ( E x ) 2 10 = 8 X y xy x2 Ex = 60 , Zy = 1106 116 464/ 16 120 600 25 E xy = 8562, E x 2 = 492 6 131 786 36 7 136 /952 49 141 128 64 a = 8 ( 8562) (1 ) - (60 * 1126 ) 151 1359 81 8 ( 492 ) - (60 ) 2 148 1480 100 1 163 1793 121 9= 89 ( 1106 ) ( 492 ) - ( 60 ) ( 8562 ) 8 ( 492) - ( 60 ) 2 y = 189 x * + 634 b= 634 7 What is the formula for the line you found? How does it compare to your original guess for a linear function to represent the data? Formula is y = 89 x + 634 ly 7 Slope = 92- yo - 120-116 = 45 89 X 2 - x 5-4 They are not related ( since slope are different)3. More Regression: The medical researcher decides to take a few more measurements to have a more complete data set. The following table represents the finalized data set detailing bacteria growth after 8 hours: PH Number of Bacteria (thousands) 3 124 4 116 5 120 6 131 7 136 8 141 9 151 10 148 11 163 12 155 With this data, calculate a new least-squares regression line. (your earlier work should help some) What is the formula you found? How does this compare to your original least-squares regression line?4. Interpolation and Extrapolation Write down the formula you calculated in part 3: Using this formula, identify the amount of bacteria cultures that would grow in a PH level of 7.5. Include your calculations: Using the formula, identify the amount of bacteria cultures that would grow in a pH level of 1. Include your calculations: Now, using your formula from part 2, find these same values. How do they compare? Which do you believe is more accurate? Why?5. Debriefing & Conclusions Write a brief response to some of the following thinking points: Do you think there is a positive, negative, or no correlation between the PH level and the growth of bacteria? What calculations support your response? From your initial guess to your two separate calculations of a least-squares regression line, how did your model change? Did your model better approximate some values versus others? Why do you think that is? Suppose that the researcher made a mistake in calculating the data, and that at the pH value of 11, there were actually 263 thousand bacteria cultures. What affect do you think this would have on the least-squares regression line? It isn't appropriate to model all data with linear functions. Sometimes, quadratic functions or even other polynomial functions are used. Do you think that a linear function was an appropriate model here? Why or why not? Write a brief response addressing each of these thinking points: . How did you use the critical thinking skill of evaluation in this scenario? Did you use any evidence or justification to support any thoughts or calculations? How did you use the critical thinking skill of analysis in this scenario? Did you analyze any charts, or recognize any relationships amongst data? When interpolating, we are using deductive reasoning. When extrapolationg, we are using inductive reasoning. What could the researcher do to evaluate your interpolations and extrapolations
Step by Step Solution
There are 3 Steps involved in it

Get step-by-step solutions from verified subject matter experts