

Question: python TASK 2: Linear regression Linear model (1) Create a function that calculates the linear equation yok.x+m where is the slope and me is the
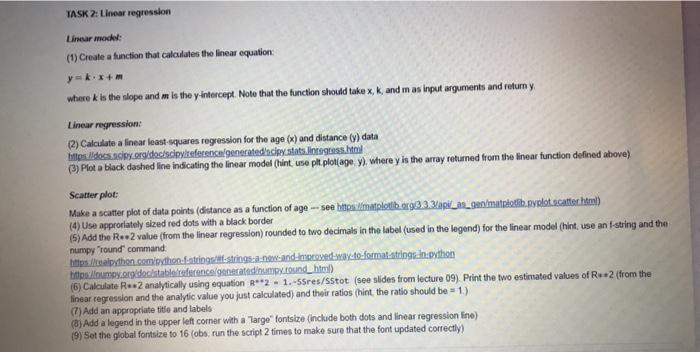
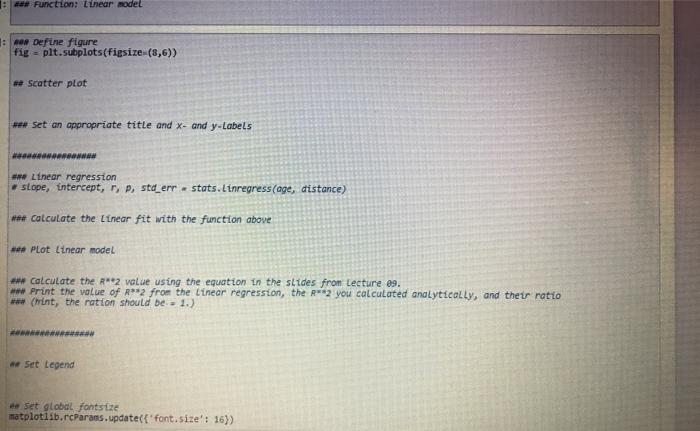
TASK 2: Linear regression Linear model (1) Create a function that calculates the linear equation yok.x+m where is the slope and me is the intercopt. Note that the function should take x, K, and mas input arguments and return y, Linear regression: (2) Calculate a linear least-squares regression for the age (x) and distance (y) data int/docsaciny org docaciny reference generated'acie stats. Inregtess.tel (3) Plot a black dashed line indicating the linear model (hint, use plt plotage, y), where y is the array returned from the Inear function defined above) Scatter plot Make a scatter plot of data points (distance as a function of age -- see hittar matplokib 09:13 3 3/api_12_gen/mutloth.pyplots.catter html) (4) Use approriately sized red dots with a black border (5) Add the R+ 2 value (from the linear regression) rounded to two decimals in the label (used in the legend) for the linear model (hint, use an t-string and the numpy round command toalbython.com/python-faitzing/strings.new-and-ovest-way-to-formattings. In othon itsnumo.org/doc/stable reference generated numby round_html) (6) Calculate R2 analytically using equation R**2 - 1.-Sres/Sstot (see slides from lecture 09). Print the two estimated values of R. 2 (from the linear regression and the analytic value you just calculated) and their ratios (hint, the ratio should be = 1) (7) Add an appropriate title and labels (3) Add a legend in the upper left corner with a large fontsize (include both dots and linear regression line) 19) Set the global fontsize to 16 (obs, run the script 2 times to make sure that the font updated correctly) # Puriction: Linear model : Define figure fig = plt.subplots(figsize-(8,6)) * Scatter plot ## Set an appropriate title and X- and y-Labels wwwwwwww # Linear regression slope, intercept, , sta_err stats. Linregress(age, distance) calculate the Linear fit with the function above Plot Linear model # Calculate the R**2 value using the equation in the slides from Lecture 09. Print the value of R**2 from the Linear regression, the R**2 you calculated analytically, and thetr ratio *** (hint, the nation should be = 1.) - Set Legend e set global fontsize matplotiib.rcParams.update('font.size: 16) # Set Legend - Set global fontstze matplotlib.rcparans.update('font.size: 16)) 1.0 0.8 0.6 0.4 0.2 0 0.0.0 0.0 0.2 0.4 0.6 0.8 1.0 Walo pynt hip
Step by Step Solution
There are 3 Steps involved in it

Get step-by-step solutions from verified subject matter experts