

Question: 2. Make a second graph using your data that shows the number of coins [it-axis) and the total thickness of the stacked coins [y-axis]. Be
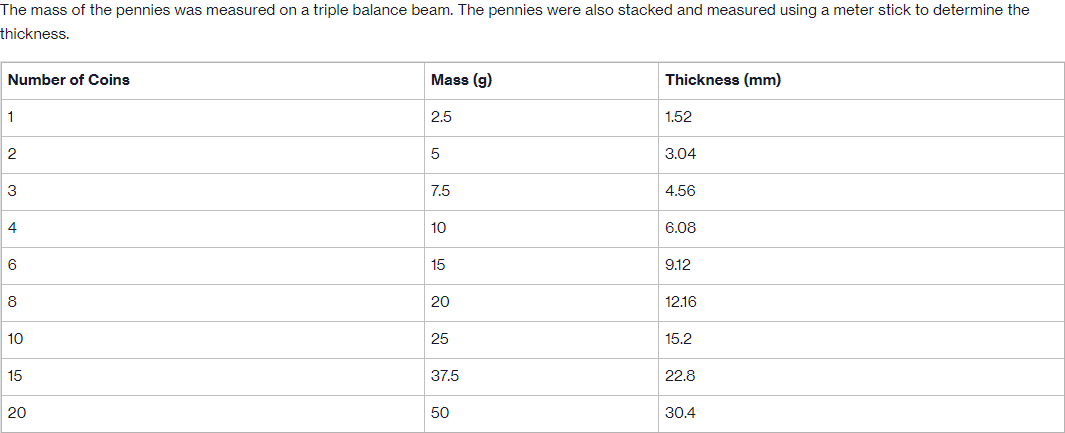
2. Make a second graph using your data that shows the number of coins [it-axis) and the total thickness of the stacked coins [y-axis]. Be sure to label each axis and draw a line of best t. Title our graph! Graph 1: Questions and Conclusions 1. Describe the appearance of your line in each graph. 2. List two errors that could exist in your measurement of the masses of the coins? 3. List two errors that could exist in your measurement ofthe lengths ofthe coins? 4. Which of the errors in question 2 or 3 would have real importance fora bank teller? 5. Does your data showa difference in the mass of the coins as the number of coins increases? Explain your answer. 6. Does your data showa difference in the thickness of the coins as the number of coins increases? Explain your answer. '3". Could you use the mass of 1 coin to determine the mass of2, 3, 4. 5, B, and III} coins? Why or why not? The mass of the pennies was measured on a triple balance beam. The pennies were also stacked and measured using a meter stick to determine the thickness. Number 01 Coins Mass (9) Thickness (mm) 1 2.5 1.52 2 5 3.04 3 7.5 4.56 4 10 6.08 6 15 9.12 8 20 10 25 15 37.5 20 50 30.4
Step by Step Solution
There are 3 Steps involved in it

Get step-by-step solutions from verified subject matter experts