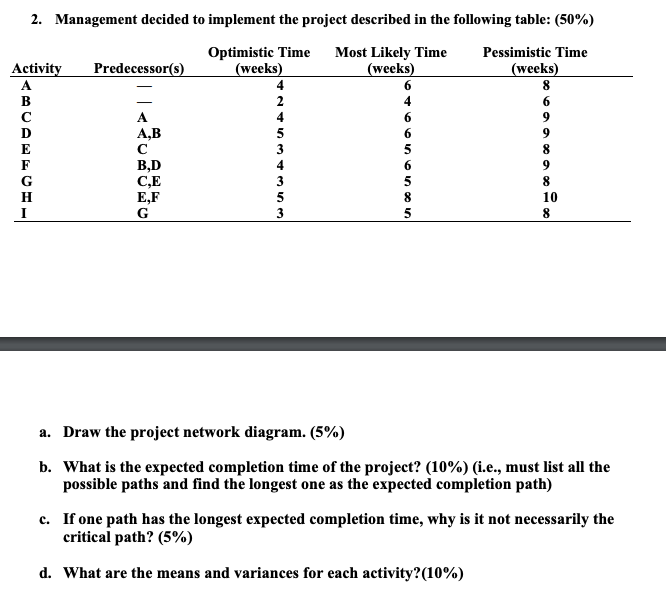
Question: 2. Management decided to implement the project described in the following table: (50%) Optimistic Time Most Likely Time Pessimistic Time Activity Predecessor(s) (weeks) (weeks) (weeks)

2. Management decided to implement the project

2. Management decided to implement the project described in the following table: (50%) Optimistic Time Most Likely Time Pessimistic Time Activity Predecessor(s) (weeks) (weeks) (weeks) A 8 B 2 6 A 9 A,B B,D 9 C,E E,F 5 10 3 5 8 Nummum 8 I G 8 a. Draw the project network diagram. (5%) b. What is the expected completion time of the project? (10%) (i.e., must list all the possible paths and find the longest one as the expected completion path) c. If one path has the longest expected completion time, why is it not necessarily the critical path? (5%) d. What are the means and variances for each activity?(10%)

Step by Step Solution

There are 3 Steps involved in it

1 Expert Approved Answer
Step: 1 Unlock blur-text-image
Question Has Been Solved by an Expert!

Get step-by-step solutions from verified subject matter experts

Step: 2 Unlock
Step: 3 Unlock

Students Have Also Explored These Related General Management Questions!