

Question: 2. Markowitz_Portfolio Given the following expected returns and standard deviations: Calculate and plot the efficient frontier for each of the following correlation coefficients: Expected Return
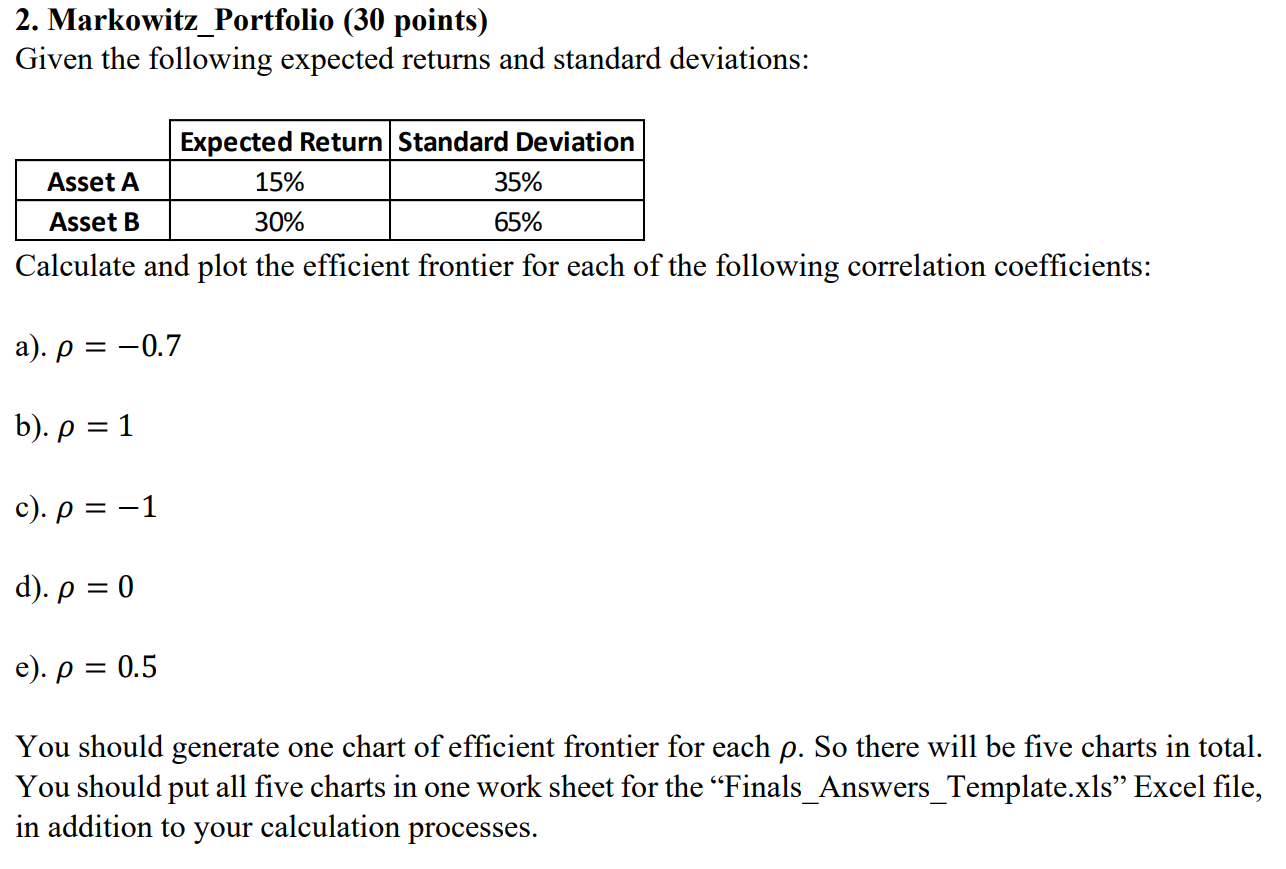
2. Markowitz_Portfolio Given the following expected returns and standard deviations: Calculate and plot the efficient frontier for each of the following correlation coefficients:
Expected Return Standard Deviation Asset A 15% 35% Asset B 30% 65%
a). = 0.7 b). = 1 c). = 1 d). = 0 e). = 0.5
You should generate one chart of efficient frontier for each . So there will be five charts in total. You should put all five charts in one work sheet for the Finals_Answers_Template.xls
Excel file, in addition to your calculation processes.
2. Markowitz_Portfolio (30 points) Given the following expected returns and standard deviations: Expected Return Standard Deviation Asset A 15% 35% Asset B 30% 65% Calculate and plot the efficient frontier for each of the following correlation coefficients: a). p = -0.7 b). p = 1 c). p = = -1 d). p = 0 e). P = 0.5 You should generate one chart of efficient frontier for each p. So there will be five charts in total. You should put all five charts in one work sheet for the Finals_Answers_Template.xls Excel file, in addition to your calculation processes. 2. Markowitz_Portfolio (30 points) Given the following expected returns and standard deviations: Expected Return Standard Deviation Asset A 15% 35% Asset B 30% 65% Calculate and plot the efficient frontier for each of the following correlation coefficients: a). p = -0.7 b). p = 1 c). p = = -1 d). p = 0 e). P = 0.5 You should generate one chart of efficient frontier for each p. So there will be five charts in total. You should put all five charts in one work sheet for the Finals_Answers_Template.xls Excel file, in addition to your calculation processes
Step by Step Solution
There are 3 Steps involved in it

Get step-by-step solutions from verified subject matter experts