

Question: 2 Maximum and Minimum Yearly Temperatures in Doylestown The image below shows the maximum and minimum yearly temperatures in the town of Doylestown ( PA
Maximum and Minimum Yearly Temperatures in Doylestown
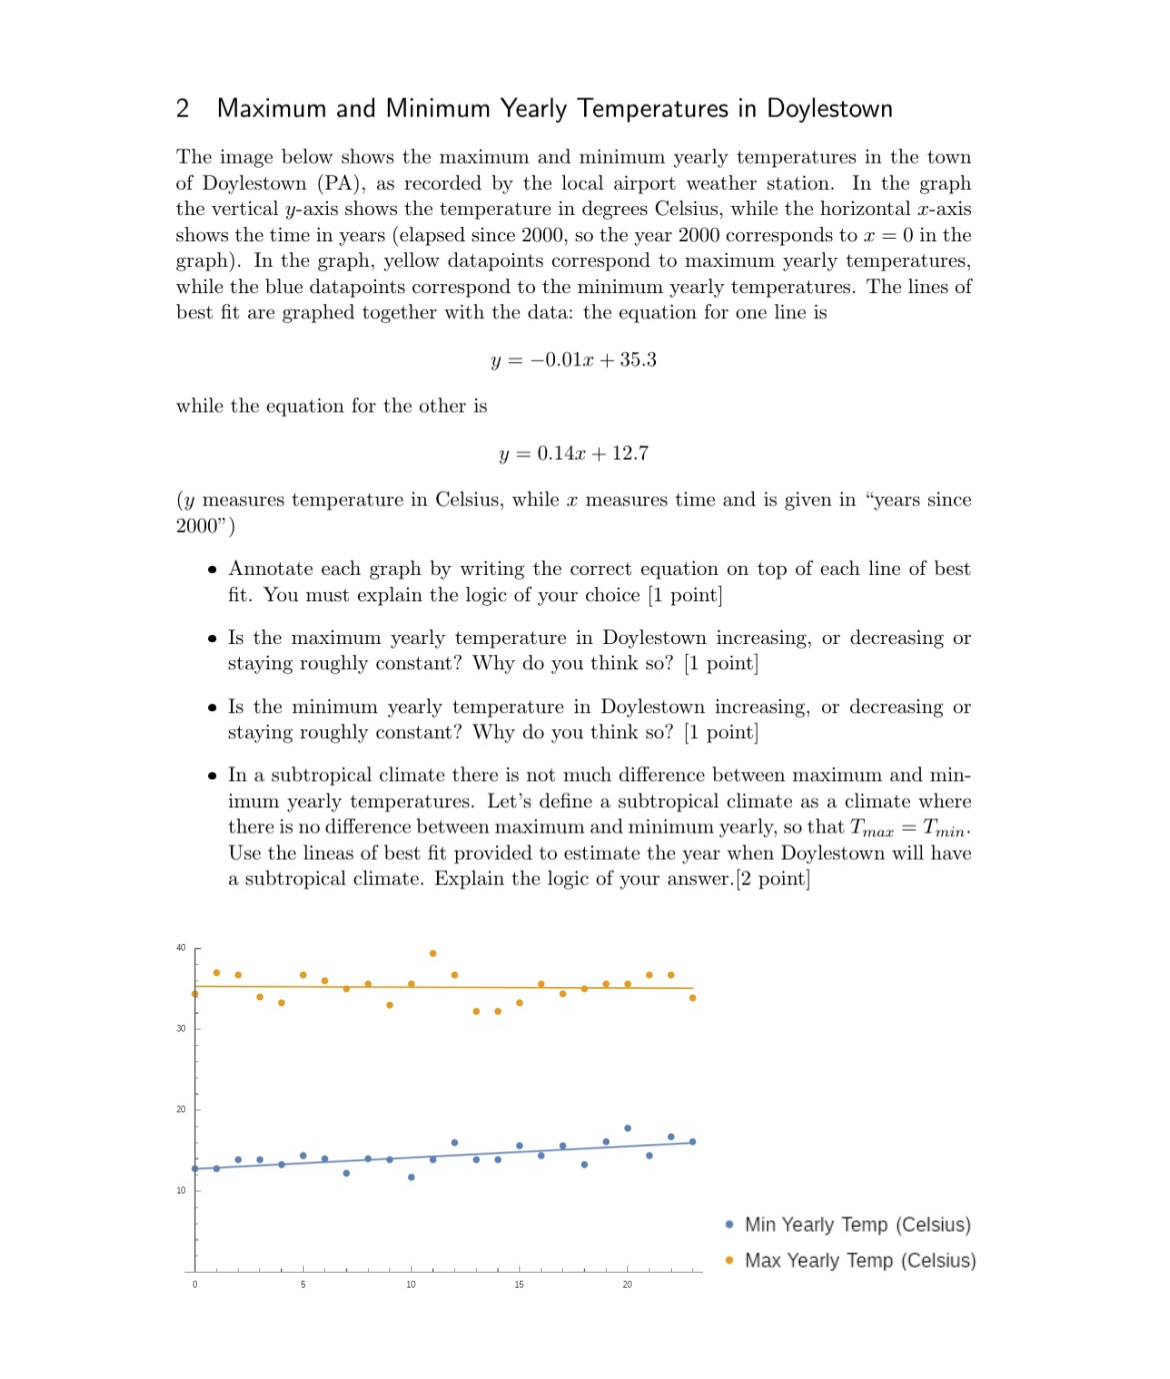
The image below shows the maximum and minimum yearly temperatures in the town of Doylestown PA as recorded by the local airport weather station. In the graph the vertical axis shows the temperature in degrees Celsius, while the horizontal axis shows the time in years elapsed since so the year corresponds to in the graph In the graph, yellow datapoints correspond to maximum yearly temperatures, while the blue datapoints correspond to the minimum yearly temperatures. The lines of best fit are graphed together with the data: the equation for one line is
while the equation for the other is
measures temperature in Celsius, while measures time and is given in "years since
Annotate each graph by writing the correct equation on top of each line of best fit. You must explain the logic of your choice point
Is the maximum yearly temperature in Doylestown increasing, or decreasing or staying roughly constant? Why do you think so point
Is the minimum yearly temperature in Doylestown increasing, or decreasing or staying roughly constant? Why do you think so point
In a subtropical climate there is not much difference between maximum and minimum yearly temperatures. Let's define a subtropical climate as a climate where there is no difference between maximum and minimum yearly, so that Use the lineas of best fit provided to estimate the year when Doylestown will have a subtropical climate. Explain the logic of your answer. point
Min Yearly Temp Celsius
Max Yearly Temp Celsius

Step by Step Solution
There are 3 Steps involved in it
1 Expert Approved Answer
Step: 1 Unlock

Question Has Been Solved by an Expert!
Get step-by-step solutions from verified subject matter experts
Step: 2 Unlock
Step: 3 Unlock