

Question: 2. Multidimensional & t-SNE scaling Problem 2: Implement the following (30 Points): Use the code below, to generate a S-Shaped dataset which is visualized below
2. Multidimensional & t-SNE scaling
Problem 2: Implement the following (30 Points):
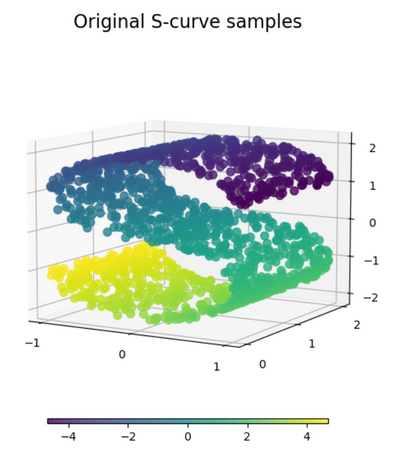
Use the code below, to generate a S-Shaped dataset which is visualized below (you do not need to plot it):
from sklearn import datasets n_samples = 1500 S_points, S_color = datasets.make_s_curve(n_samples, random_state=0)
Perform Multidimensional scaling and t-SNE scaling on the given dataset respectively, with parameters max_iters=50, n_components=2 for MDS, n_iters=250 for t-SNE, and randoms_state=0 for both methods.
Plot a 2-D graph for each reduced dataset, which should look similar to the plots below (figures are intentionally blurred to not reveal the correct answer). Note: Use the S_color generated from make_s_curve when you do scatter plot)
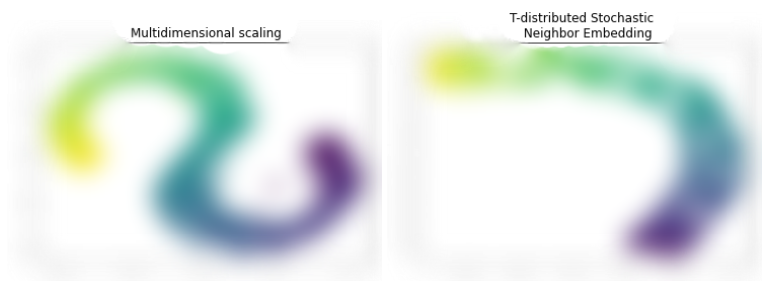
Original S-curve samples T-distributed Stochastic Multidimensional scaling Neighbor Embedding
Step by Step Solution
There are 3 Steps involved in it

Get step-by-step solutions from verified subject matter experts