

Question: 2. Patterns in partial tables Select the correct entries from the dropdown menus to complete the following table of possible results when analyzing the effect


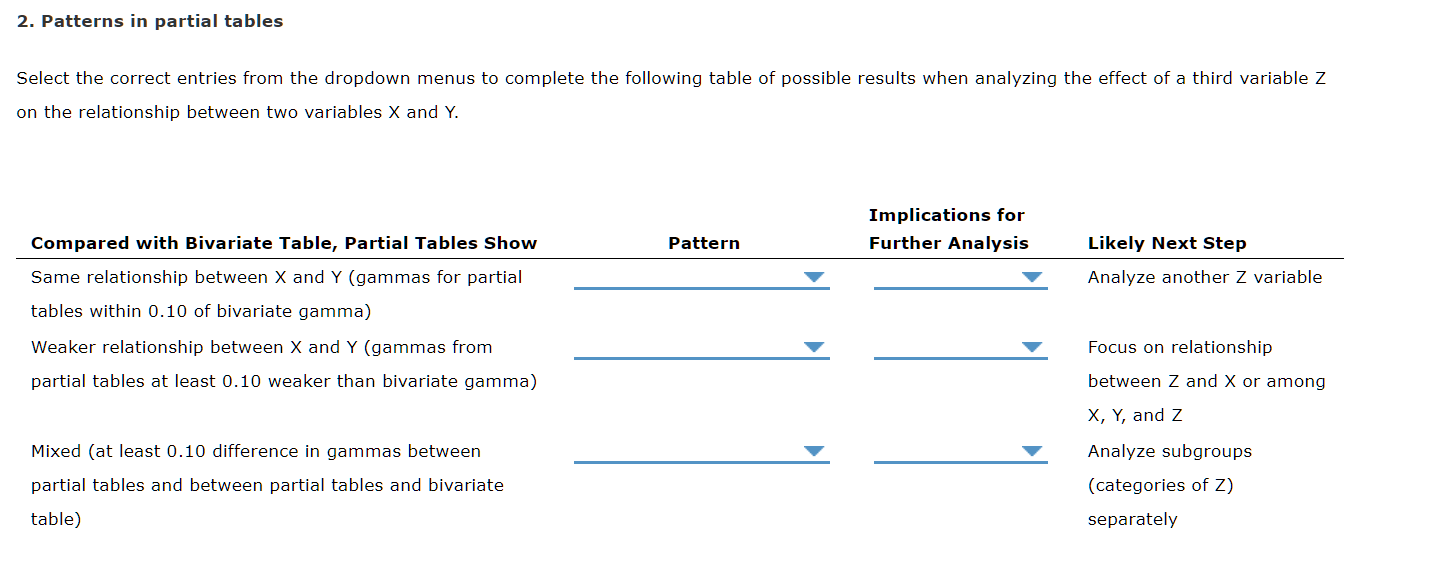
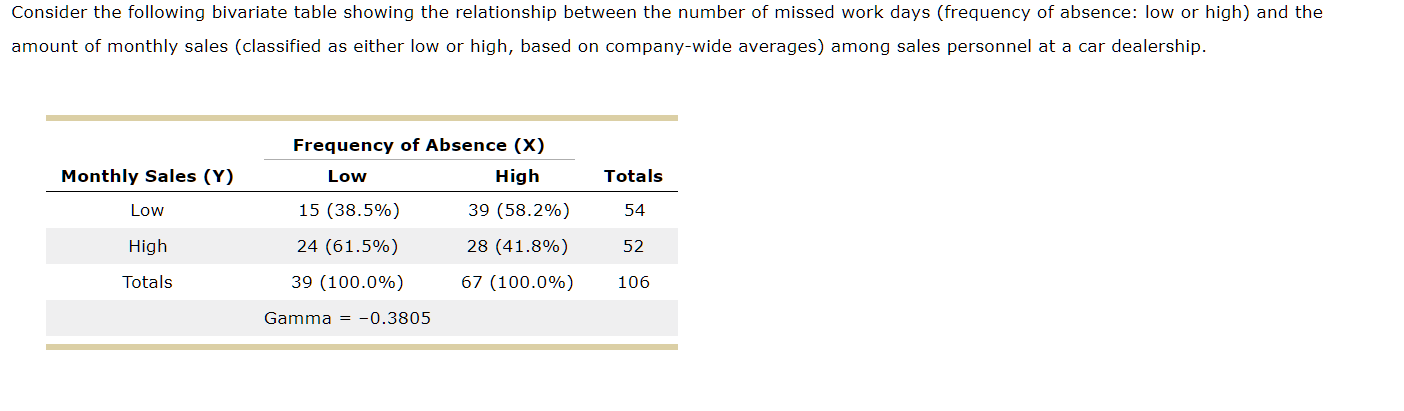


2. Patterns in partial tables Select the correct entries from the dropdown menus to complete the following table of possible results when analyzing the effect of a third variable Z on the relationship between two variables X and Y. Compared with Bivariate Table, Partial Tables Show Same relationship between X and Y (gammas for partial tables within 0.10 of bivariate gamma) Weaker relationship between X and Y (gammas from partial tables at least 0.10 weaker than bivariate gamma) Mixed (at least 0.10 difference in gammas between partial tables and between partial tables and bivariate table) Pattern Implications for Further Analysis V Likely Next Step Analyze another 2 variable Focus on relationship between Z and X or among X, Y, and Z Analyze subgroups (categories of Z) separately Consider the following bivariate table showing the relationship between the number of missed work days (frequency of absence: low or high) and the amount of monthly sales (classified as either low or high, based on companyiwide averages) among sales personnel at a car dealership. Frequency of Absence (X) Monthly Sales (Y) Low High Totals Low 15 (38.5%) 39 (58.2%) 54 High 24 (61.5%) 28 (41.8%) 52 Totals 39 (100.0%) 67 (100.0%) 106 Gamma = O.3805 Compared with the bivariate table, the partial tables show Y relationship between the number of missed work days and the amount of monthly sales. This is evidence of V relationship between the X and Y variables and implies that you should 7 the variable Z (age) in further analysis. The data in the table suggest that there is V association between the number of missed work days (X) and the amount of monthly sales (Y) - Here are the partial tables showing the bivariate relationship between X and Y after controlling for age
Step by Step Solution
There are 3 Steps involved in it

Get step-by-step solutions from verified subject matter experts