

Question: 2. Perform a capability analysis using 30 items of something such as beans or elbow macaroni, m&m's etc. that you can easily get your
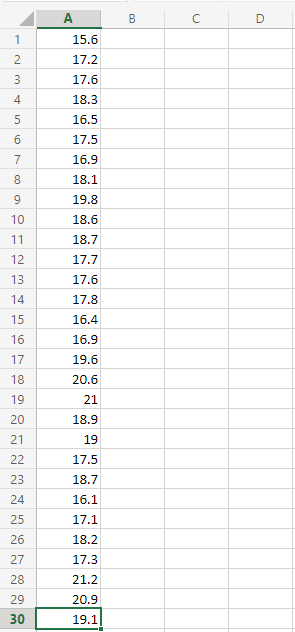
2. Perform a capability analysis using 30 items of something such as beans or elbow macaroni, m&m's etc. that you can easily get your hands on. Assume a specification that makes sense for your choice of item. If there is very little variation in your measurements, consider a tolerance range of 8 mm. Is the population of items from which you made your measurements capable of meeting the specifications? What recommendations might you have to improve the capability? One thing to note, using a ruler on items with very little variation can lead to only 3 or 4 values for the entire lot. If you do a test for normality, it will likely fail because the data is not really continuous but instead only a very few values. If you had an instrument with better resolution, you would likely have a regular, normal looking histogram. IF your histogram has central tendency and falls off on both sides of the middle, you can assume the data are close enough to normal for this application. If your data are skewed to the right, consider using either a lognormal or Weibull distribution with your data. 1 A 15.6 2 17.2 3 17.6 4 18.3 5 16.5 6 17.5 7 16.9 00 18.1 9 19.8 10 18.6 11 18.7 12 17.7 13 17.6 14 17.8 15 16.4 16 16.9 17 19.6 18 20.6 19 21 20 18.9 21 19 22 17.5 23 18.7 24 16.1 25 17.1 26 18.2 27 17.3 28 21.2 29 20.9 30 19.1 B C D
Step by Step Solution
There are 3 Steps involved in it

Get step-by-step solutions from verified subject matter experts