Question: 2. (Please list the explanations for each question in 1,2,3 format corresponding with the numbers I listed each photo with. Thank You) 3. 4. 5.
2. 
(Please list the explanations for each question in 1,2,3 format corresponding with the numbers I listed each photo with. Thank You)
3. 
4.
5.
6.
7.
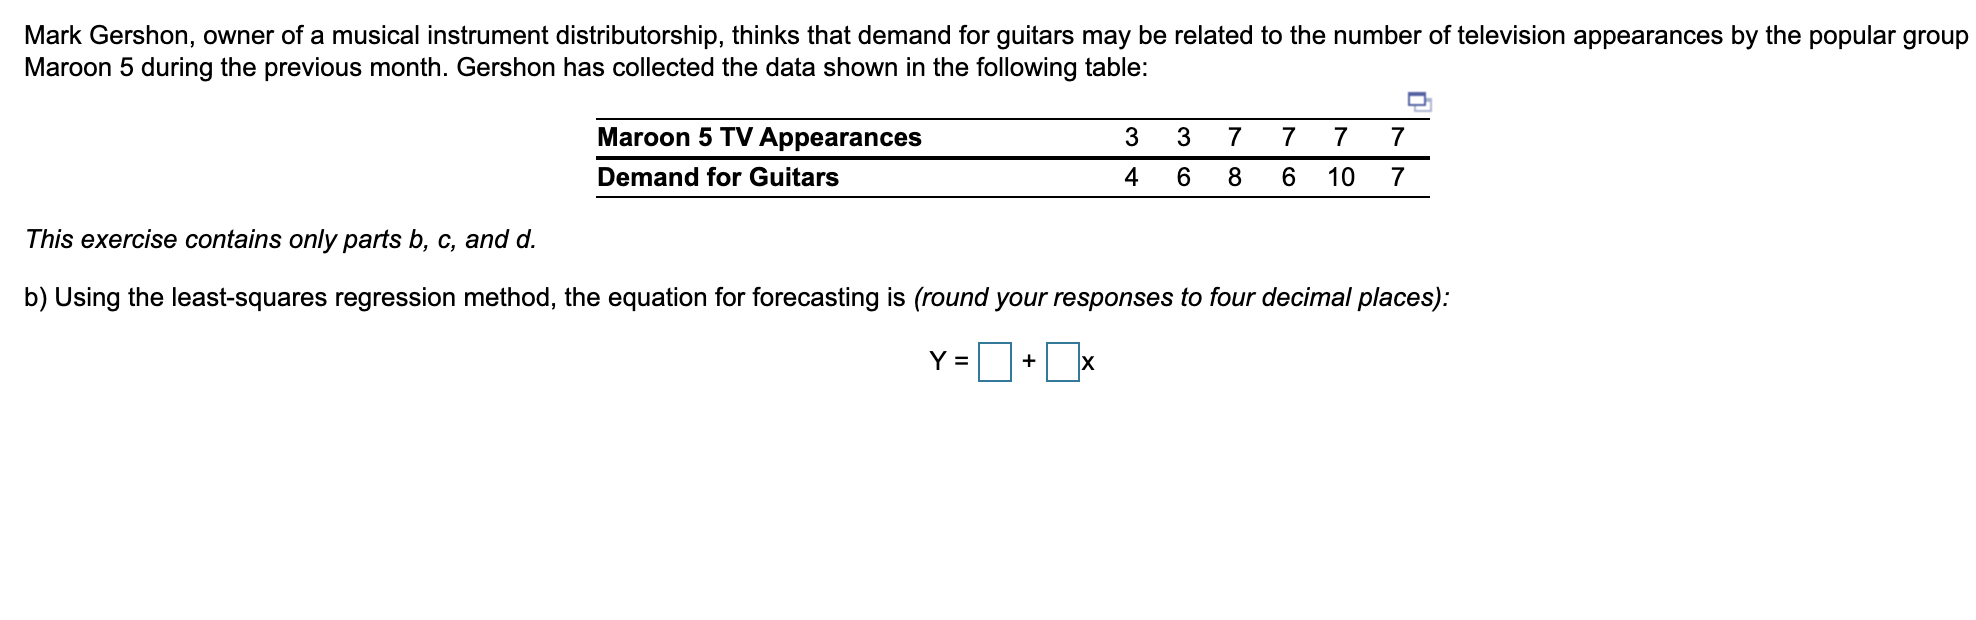
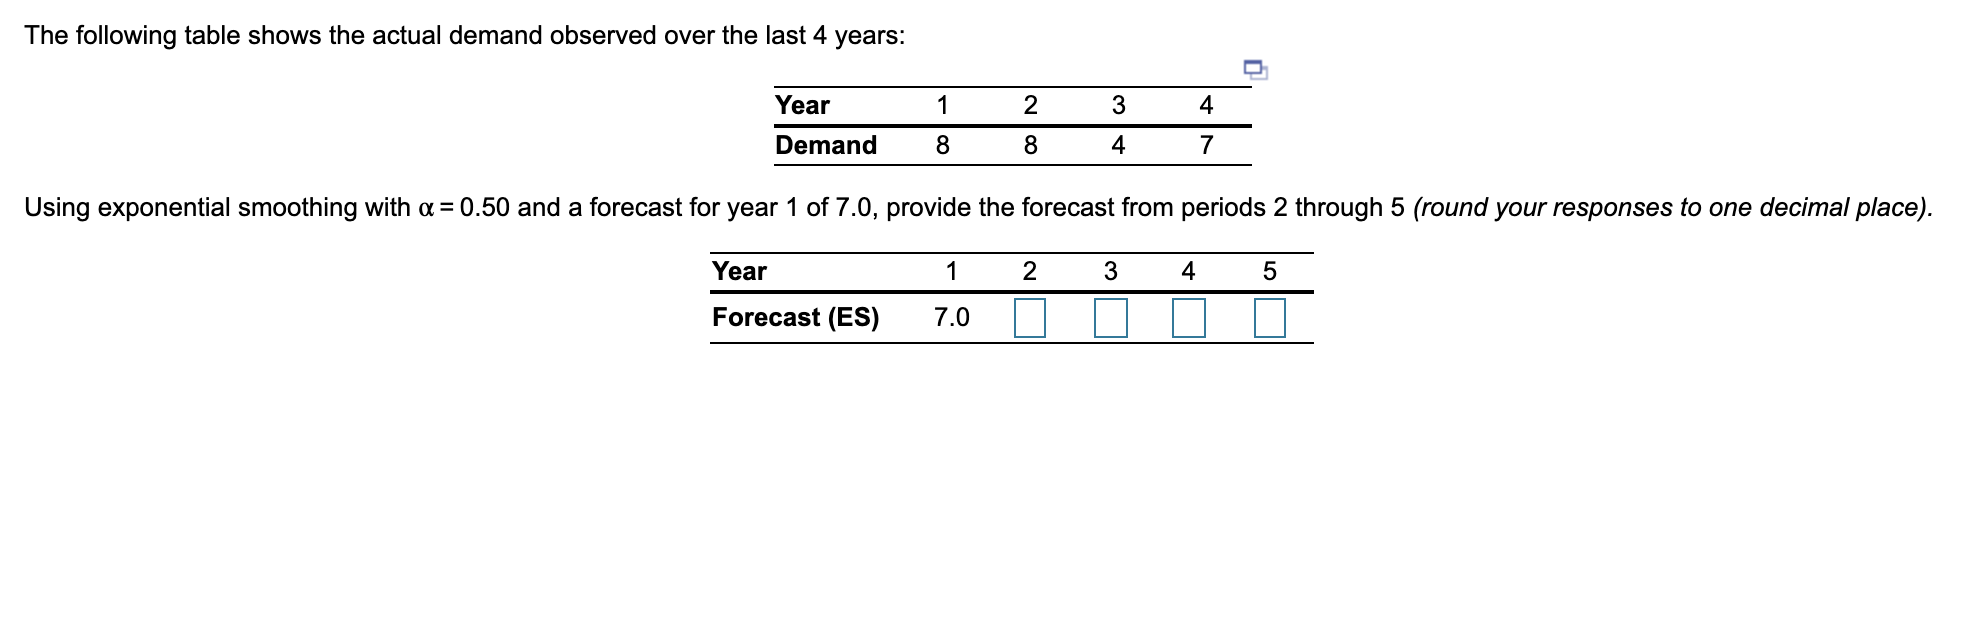
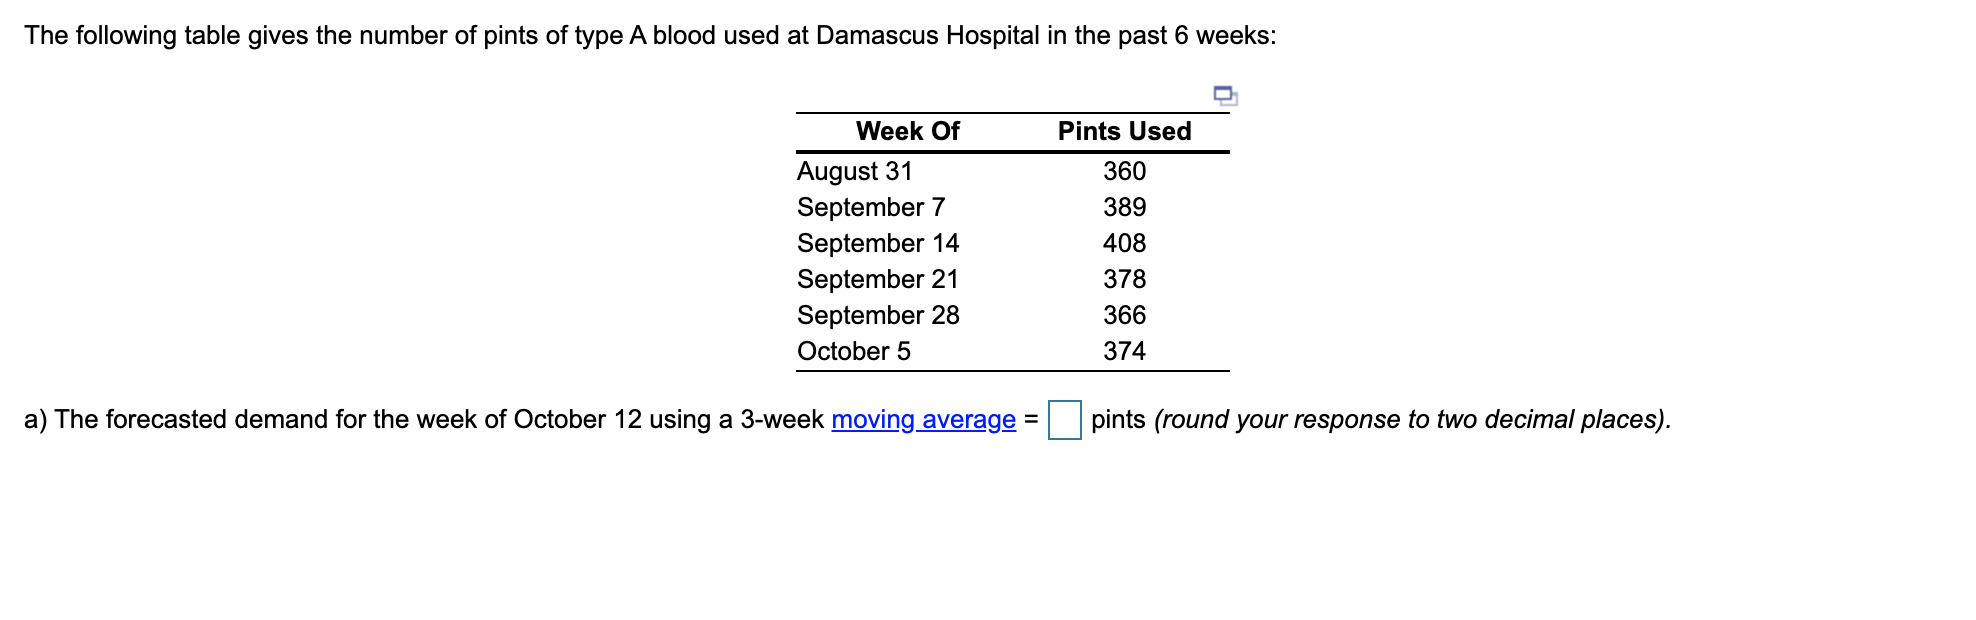
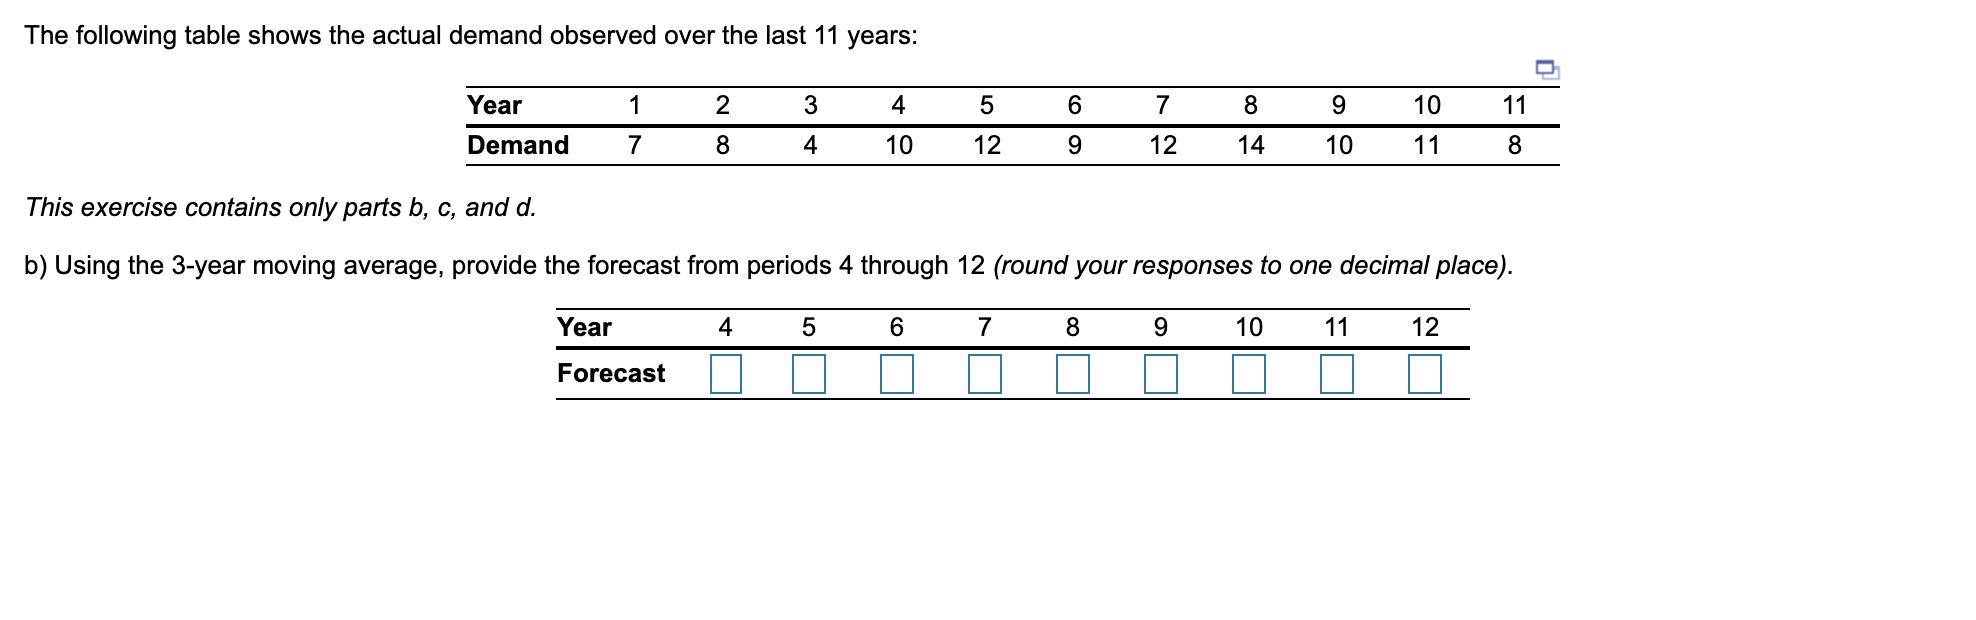
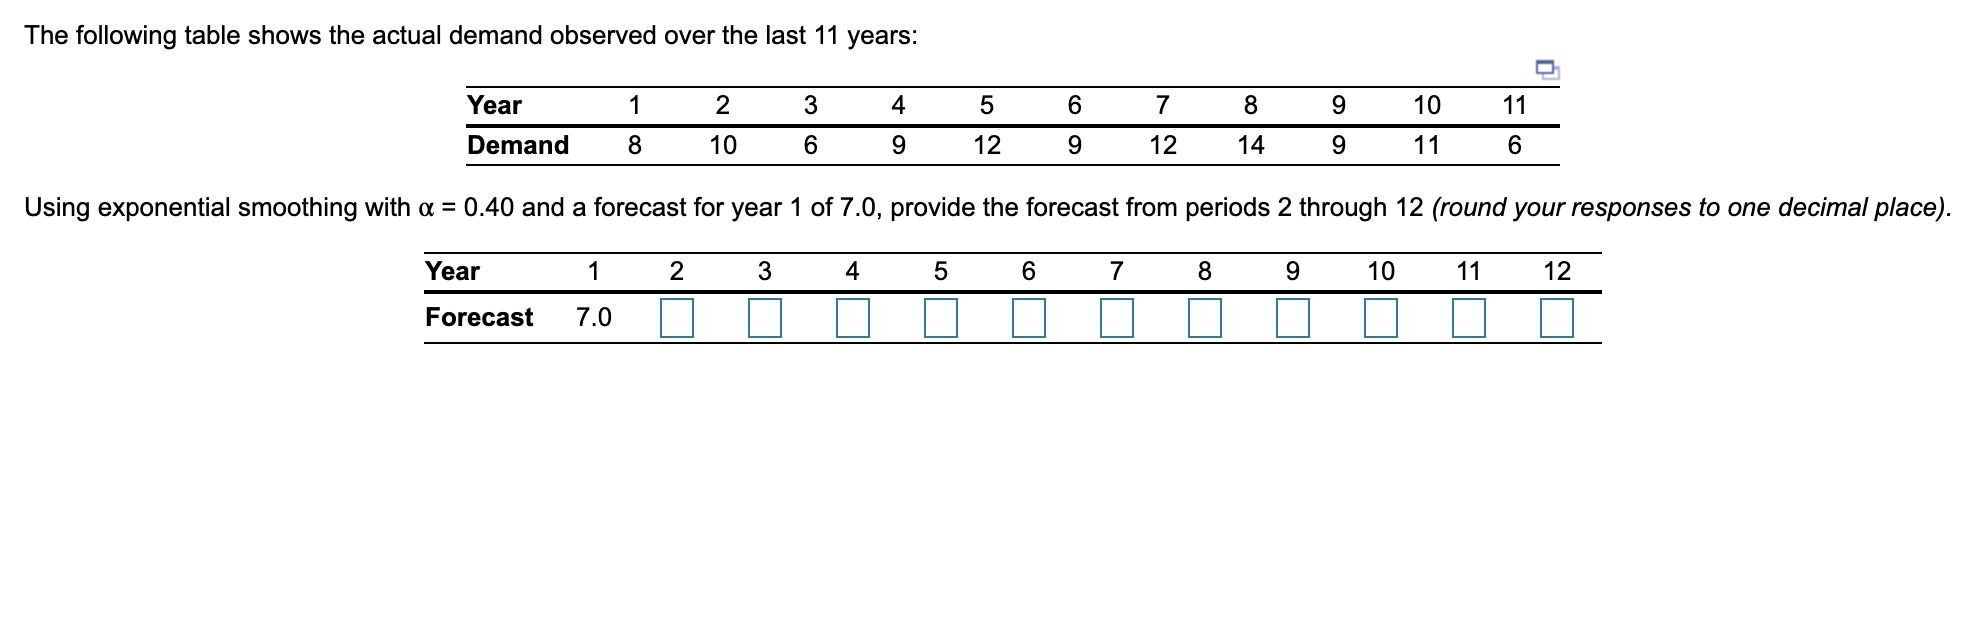
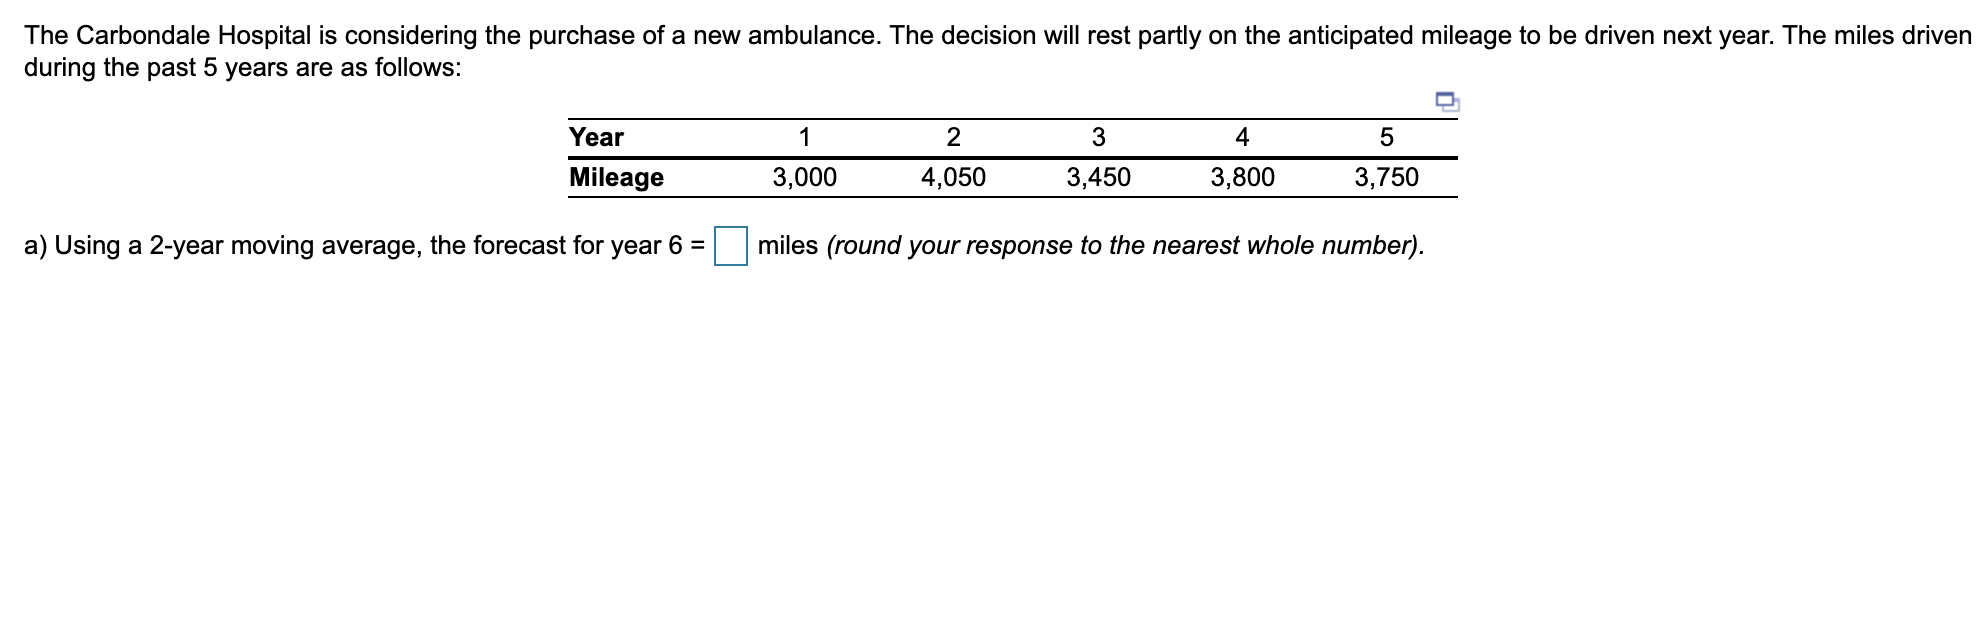
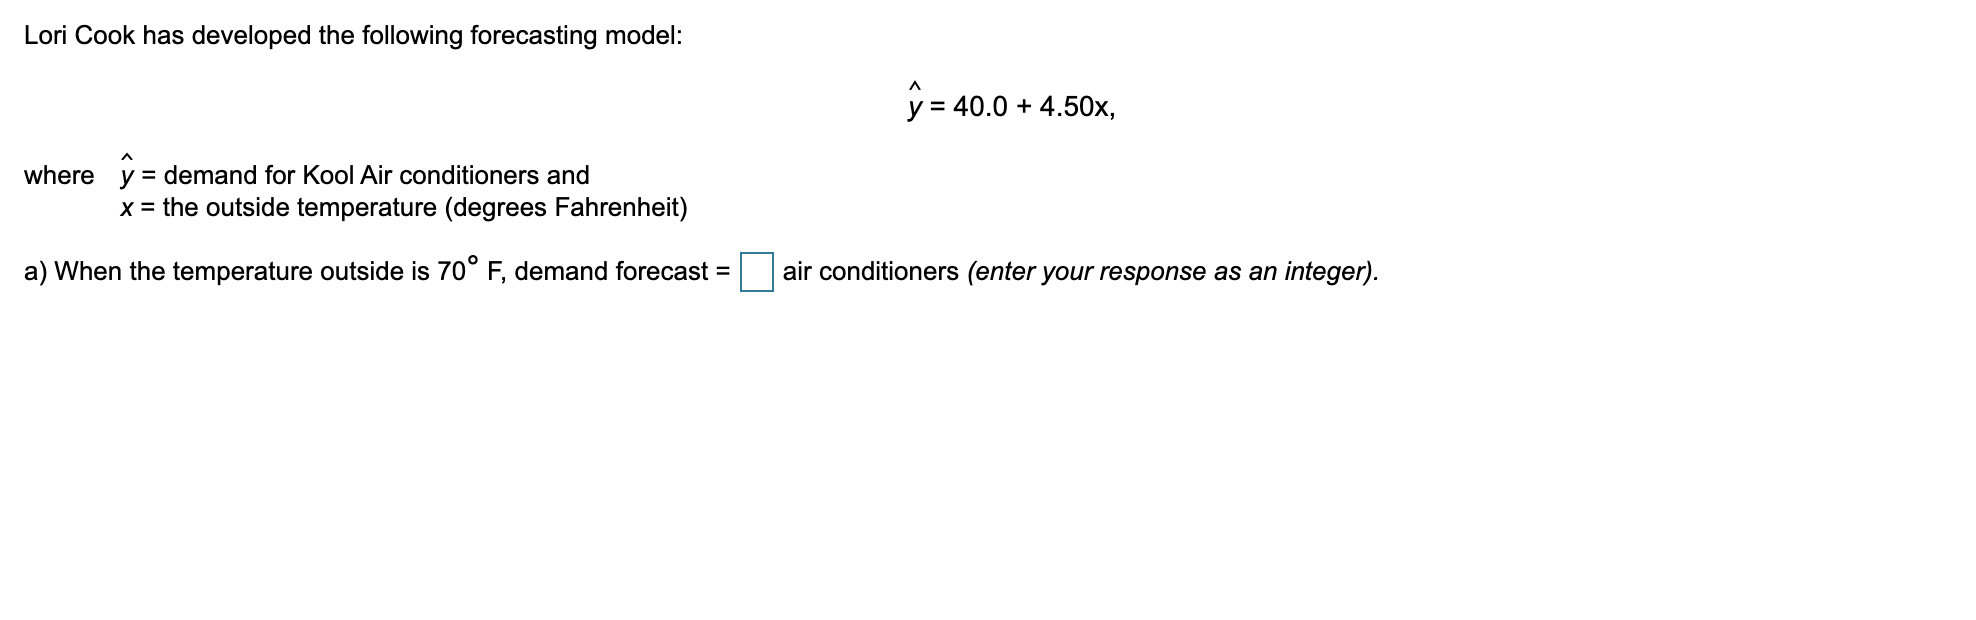
The following table shows the actual demand observed over the last 4 years: 3 1 3 4 Year Demand wloo 8 4 7 Using exponential smoothing with a = 0.50 and a forecast for year 1 of 7.0, provide the forecast from periods 2 through 5 (round your responses to one decimal place). Year 2 3 4 5 Forecast (ES) 7.0 The following table gives the number of pints of type A blood used at Damascus Hospital in the past 6 weeks: Pints Used Week Of August 31 September 7 September 14 September 21 September 28 October 5 360 389 408 378 366 374 a) The forecasted demand for the week of October 12 using a 3-week moving average = pints (round your response to two decimal places). The following table shows the actual demand observed over the last 11 years: 2 3 4 5 6 7 8 9 10 11 Year Demand 7 8 4 10 12 9 12 14 10 11 8 This exercise contains only parts b, c, and d. b) Using the 3-year moving average, provide the forecast from periods 4 through 12 (round your responses to one decimal place). Year 4 5 6 7 8 9 10 11 12 Forecast The following table shows the actual demand observed over the last 11 years: 1 2 3 4 5 6 7 8 9 10 11 Year Demand 8 10 6 9 12 9 12 14 9 11 6 Using exponential smoothing with a = 0.40 and a forecast for year 1 of 7.0, provide the forecast from periods 2 through 12 (round your responses to one decimal place). Year 2 3 4 5 6 7 8 9 10 11 12 Forecast 7.0 The Carbondale Hospital is considering the purchase of a new ambulance. The decision will rest partly on the anticipated mileage to be driven next year. The miles driven during the past 5 years are as follows: 1 2 3 4 5 Year Mileage 3,000 4,050 3,450 3,800 3,750 a) Using a 2-year moving average, the forecast for year 6 = miles (round your response to the nearest whole number). Lori Cook has developed the following forecasting model: =4 = 40.0 + 4.50x, where = demand for Kool Air conditioners and x = the outside temperature (degrees Fahrenheit) a) When the temperature outside is 70 F, demand forecast = air conditioners (enter your response as an integer). Mark Gershon, owner of a musical instrument distributorship, thinks that demand for guitars may be related to the number of television appearances by the popular group Maroon 5 during the previous month. Gershon has collected the data shown in the following table: 3 3 7 7 7 7 Maroon 5 TV Appearances Demand for Guitars 4 6 8 6 10 7 This exercise contains only parts b, c, and d. b) Using the least-squares regression method, the equation for forecasting is (round your responses to four decimal places): Y = + x


