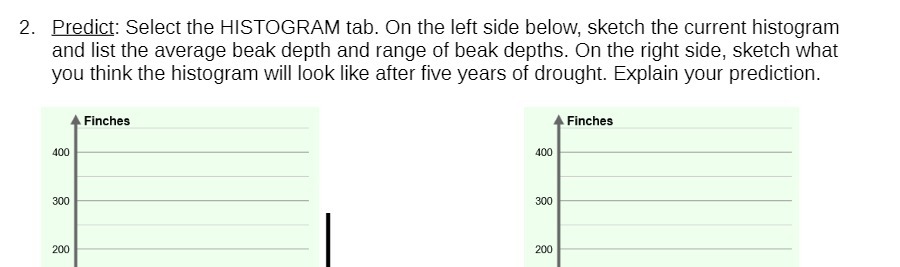
Question: 2. Predict: Select the HISTOGRAM tab. On the left side below, sketch the current histogram and list the average beak depth and range of beak

2. Predict: Select the HISTOGRAM tab. On the left
2. Predict: Select the HISTOGRAM tab. On the left side below, sketch the current histogram and list the average beak depth and range of beak depths. On the right side, sketch what you think the histogram will look like after five years of drought. Explain your prediction. Finches Finches 400 400 300 300 200 200

Step by Step Solution

There are 3 Steps involved in it

1 Expert Approved Answer
Step: 1 Unlock blur-text-image
Question Has Been Solved by an Expert!

Get step-by-step solutions from verified subject matter experts

Step: 2 Unlock
Step: 3 Unlock

Students Have Also Explored These Related Mathematics Questions!