

Question: 2. Present the regression-based cost functions as well as the high-low method cost functions to determine equations you could use to predict overhead costs. Predict
2. Present the regression-based cost functions as well as the high-low method cost functions to determine equations you could use to predict overhead costs. Predict total MOH costs for January under each equation if Selmet forecast 21,500 direct labor hours and 4,500 units in January.
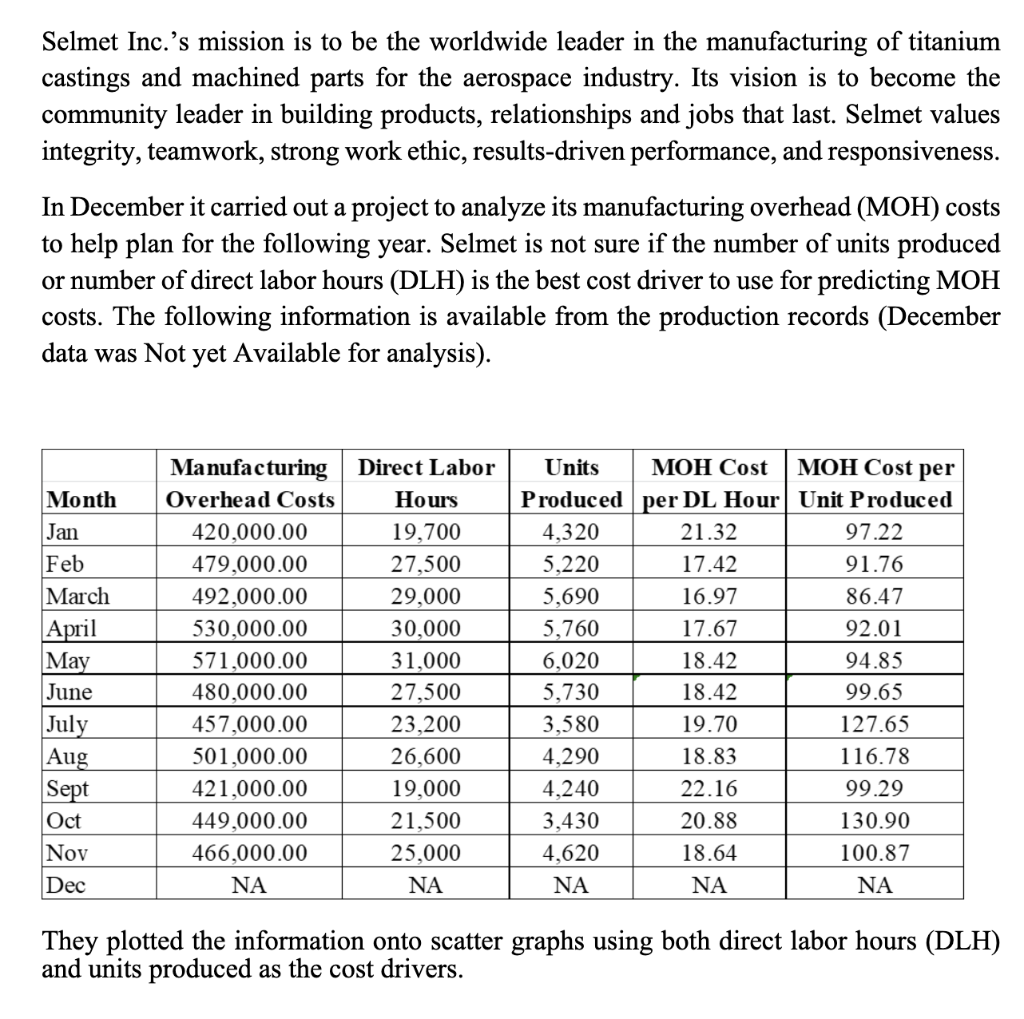
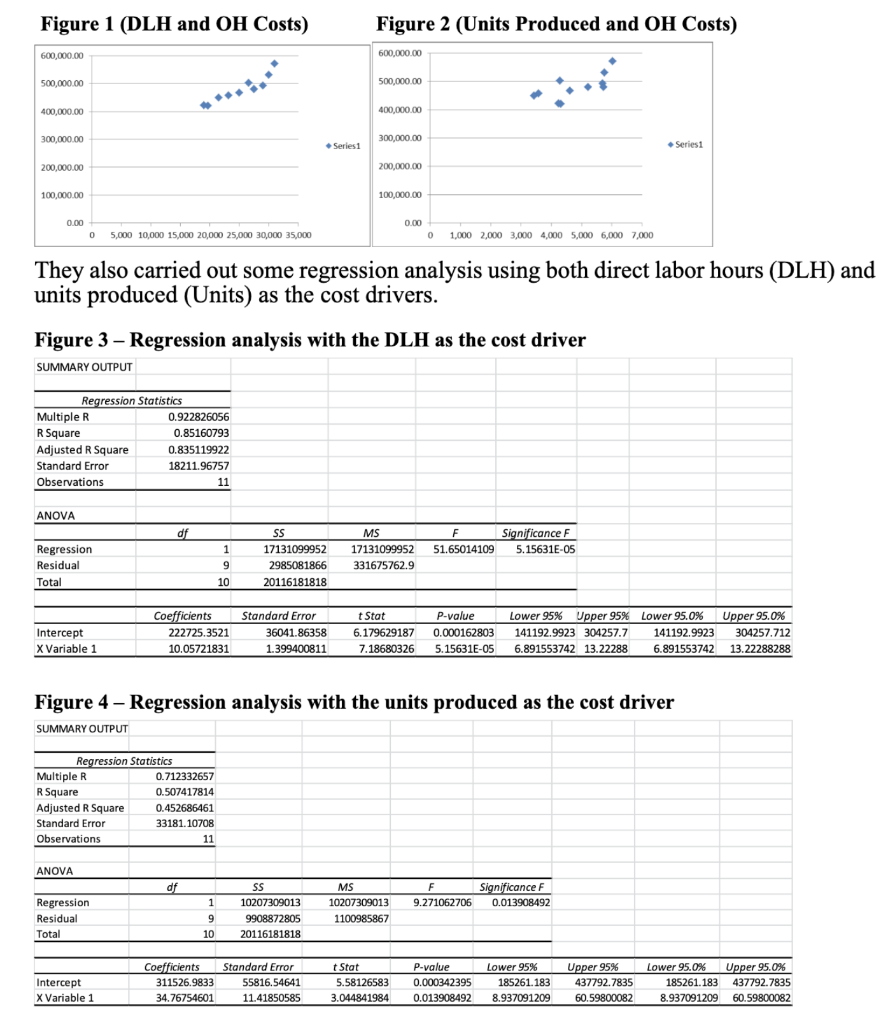
Selmet Inc.'s mission is to be the worldwide leader in the manufacturing of titanium castings and machined parts for the aerospace industry. Its vision is to become the community leader in building products, relationships and jobs that last. Selmet values integrity, teamwork, strong work ethic, results-driven performance, and responsiveness. In December it carried out a project to analyze its manufacturing overhead (MOH) costs to help plan for the following year. Selmet is not sure if the number of units produced or number of direct labor hours (DLH) is the best cost driver to use for predicting MOH costs. The following information is available from the production records (December data was Not yet Available for analysis). Month Jan Feb March April May June July Aug Sept Oct Nov Dec Manufacturing Overhead Costs 420,000.00 479,000.00 492,000.00 530,000.00 571,000.00 480,000.00 457,000.00 501,000.00 421,000.00 449,000.00 466,000.00 NA Direct Labor Hours 19,700 27,500 29,000 30,000 31,000 27,500 23,200 26,600 19,000 21,500 25,000 NA Units MOH Cost MOH Cost per Produced per DL Hour Unit Produced 4,320 21.32 97.22 5,220 17.42 91.76 5,690 16.97 86.47 5,760 17.67 92.01 6,020 18.42 94.85 5,730 18.42 99.65 3,580 19.70 127.65 4,290 18.83 116.78 4,240 22.16 99.29 3,430 20.88 130.90 4,620 18.64 100.87 NA NA NA They plotted the information onto scatter graphs using both direct labor hours (DLH) and units produced as the cost drivers. Figure 1 (DLH and OH Costs) Figure 2 (Units Produced and OH Costs) 600,000.00 600,000.00 500,000.00 500,000.00 400,000.00 400,000.00 300,000.00 300,000.00 Series1 1 Series1 200,000.00 200,000.00 100,000.00 100,000.00 0.00 0.00 0 5,000 10,000 15,000 20,000 25,000 30,000 35,000 0 1,000 2,000 3,000 4,000 5,000 6,000 7,000 They also carried out some regression analysis using both direct labor hours (DLH) and units produced (Units) as the cost drivers. Figure 3 - Regression analysis with the DLH as the cost driver SUMMARY OUTPUT Regression Statistics Multiple R 0.922826056 R Square 0.85160793 Adjusted R Square 0.835119922 Standard Error 18211.96757 Observations 11 ANOVA df F 51.65014109 Significance F 5.15631E-05 1 Regression Residual Total MS 17131099952 331675762.9 SS 17131099952 2985081866 20116181818 9 10 Intercept X Variable 1 Coefficients 222725.3521 10.05721831 Standard Error 36041.86358 1.399400811 t Stat P-value 6.179629187 0.000162803 7.18680326 5.15631E-05 Lower 95% Upper 95% Lower 95.0% Upper 95.0% 141192.9923 304257.7 141192.9923 304257.712 6.891553742 13.22288 6.891553742 13.22288288 Figure 4 - Regression analysis with the units produced as the cost driver SUMMARY OUTPUT Regression Statistics Multiple R 0.712332657 R Square 0.507417814 Adjusted R Square 0.452686461 Standard Error 33181.10708 Observations 11 ANOVA df F Significance F 9.271062706 0.013908492 1 Regression Residual Total SS 10207309013 9908872805 20116181818 MS 10207309013 1100985867 9 10 Intercept X Variable 1 Coefficients 311526.9833 34.76754601 Standard Error 55816.54641 11.41850585 t Stat 5.58126583 3.044841984 P-value 0.000342395 0.013908492 Lower 95% 185261.183 8.937091209 Upper 95% 437792.7835 60.59800082 Lower 95.0% Upper 95.0% 185261.183 437792.7835 8.937091209 60.59800082 Selmet Inc.'s mission is to be the worldwide leader in the manufacturing of titanium castings and machined parts for the aerospace industry. Its vision is to become the community leader in building products, relationships and jobs that last. Selmet values integrity, teamwork, strong work ethic, results-driven performance, and responsiveness. In December it carried out a project to analyze its manufacturing overhead (MOH) costs to help plan for the following year. Selmet is not sure if the number of units produced or number of direct labor hours (DLH) is the best cost driver to use for predicting MOH costs. The following information is available from the production records (December data was Not yet Available for analysis). Month Jan Feb March April May June July Aug Sept Oct Nov Dec Manufacturing Overhead Costs 420,000.00 479,000.00 492,000.00 530,000.00 571,000.00 480,000.00 457,000.00 501,000.00 421,000.00 449,000.00 466,000.00 NA Direct Labor Hours 19,700 27,500 29,000 30,000 31,000 27,500 23,200 26,600 19,000 21,500 25,000 NA Units MOH Cost MOH Cost per Produced per DL Hour Unit Produced 4,320 21.32 97.22 5,220 17.42 91.76 5,690 16.97 86.47 5,760 17.67 92.01 6,020 18.42 94.85 5,730 18.42 99.65 3,580 19.70 127.65 4,290 18.83 116.78 4,240 22.16 99.29 3,430 20.88 130.90 4,620 18.64 100.87 NA NA NA They plotted the information onto scatter graphs using both direct labor hours (DLH) and units produced as the cost drivers. Figure 1 (DLH and OH Costs) Figure 2 (Units Produced and OH Costs) 600,000.00 600,000.00 500,000.00 500,000.00 400,000.00 400,000.00 300,000.00 300,000.00 Series1 1 Series1 200,000.00 200,000.00 100,000.00 100,000.00 0.00 0.00 0 5,000 10,000 15,000 20,000 25,000 30,000 35,000 0 1,000 2,000 3,000 4,000 5,000 6,000 7,000 They also carried out some regression analysis using both direct labor hours (DLH) and units produced (Units) as the cost drivers. Figure 3 - Regression analysis with the DLH as the cost driver SUMMARY OUTPUT Regression Statistics Multiple R 0.922826056 R Square 0.85160793 Adjusted R Square 0.835119922 Standard Error 18211.96757 Observations 11 ANOVA df F 51.65014109 Significance F 5.15631E-05 1 Regression Residual Total MS 17131099952 331675762.9 SS 17131099952 2985081866 20116181818 9 10 Intercept X Variable 1 Coefficients 222725.3521 10.05721831 Standard Error 36041.86358 1.399400811 t Stat P-value 6.179629187 0.000162803 7.18680326 5.15631E-05 Lower 95% Upper 95% Lower 95.0% Upper 95.0% 141192.9923 304257.7 141192.9923 304257.712 6.891553742 13.22288 6.891553742 13.22288288 Figure 4 - Regression analysis with the units produced as the cost driver SUMMARY OUTPUT Regression Statistics Multiple R 0.712332657 R Square 0.507417814 Adjusted R Square 0.452686461 Standard Error 33181.10708 Observations 11 ANOVA df F Significance F 9.271062706 0.013908492 1 Regression Residual Total SS 10207309013 9908872805 20116181818 MS 10207309013 1100985867 9 10 Intercept X Variable 1 Coefficients 311526.9833 34.76754601 Standard Error 55816.54641 11.41850585 t Stat 5.58126583 3.044841984 P-value 0.000342395 0.013908492 Lower 95% 185261.183 8.937091209 Upper 95% 437792.7835 60.59800082 Lower 95.0% Upper 95.0% 185261.183 437792.7835 8.937091209 60.59800082Step by Step Solution
There are 3 Steps involved in it
1 Expert Approved Answer
Step: 1 Unlock

Question Has Been Solved by an Expert!
Get step-by-step solutions from verified subject matter experts
Step: 2 Unlock
Step: 3 Unlock