

Question: 2. Production function and economic growth The production function of a hypothetical economy is: Q = T (L, K) The Q stands for real
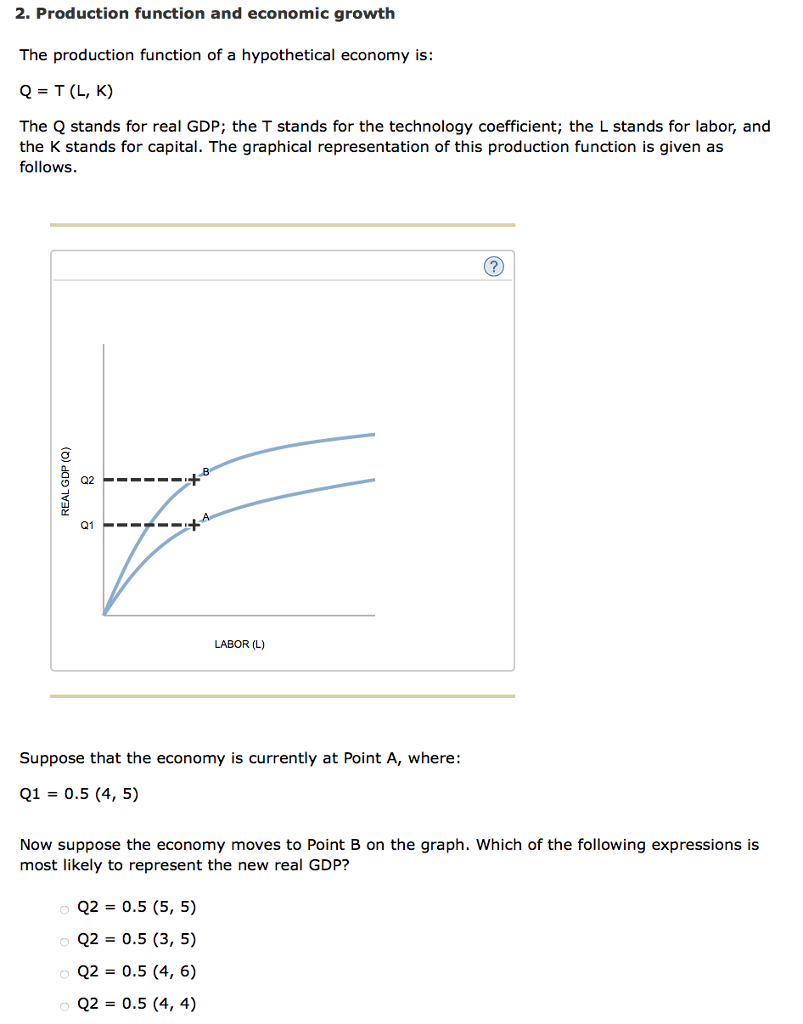
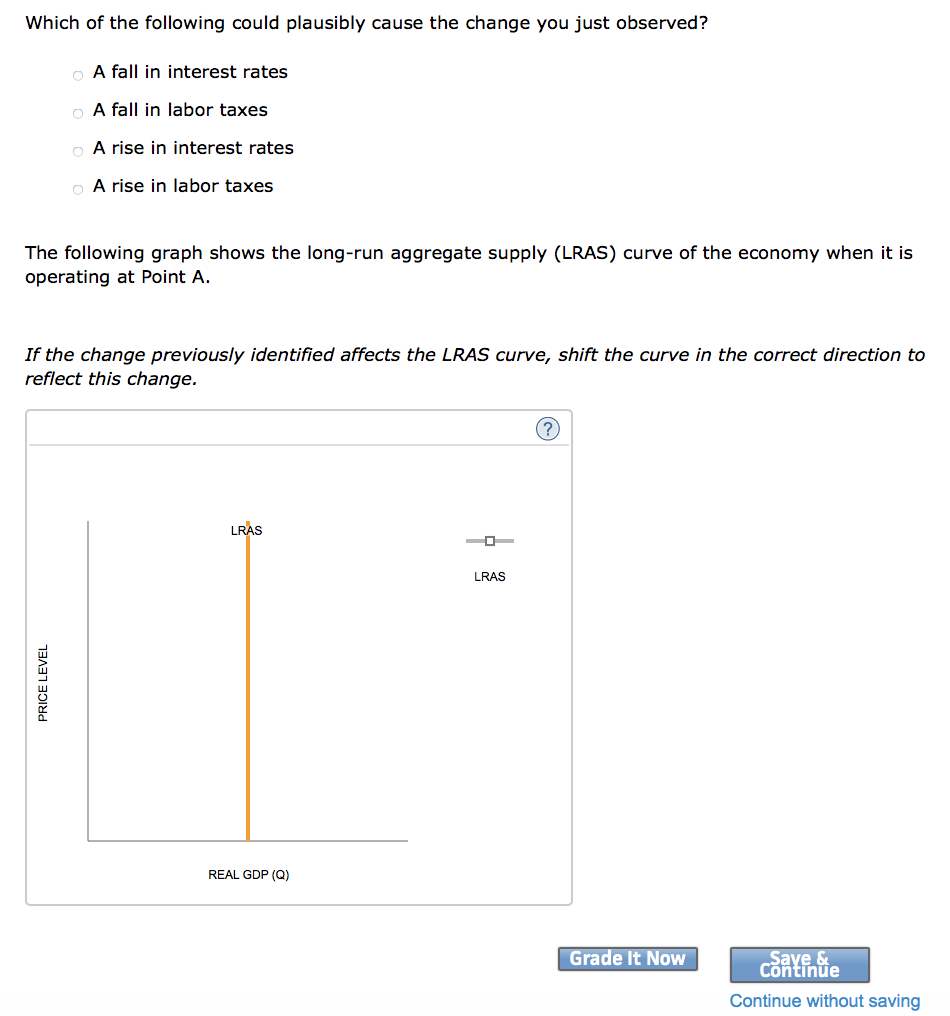
2. Production function and economic growth The production function of a hypothetical economy is: Q = T (L, K) The Q stands for real GDP; the T stands for the technology coefficient; the L stands for labor, and the K stands for capital. The graphical representation of this production function is given as follows. REAL GDP (Q) fy LABOR (L) Suppose that the economy is currently at Point A, where: Q1 = 0.5 (4, 5) o Q2 = 0.5 (5, 5) o Q2 = 0.5 (3, 5) o Q2 = 0.5 (4, 6) o Q2 = 0.5 (4,4) (?) Now suppose the economy moves to Point B on the graph. Which of the following expressions is most likely to represent the new real GDP? Which of the following could plausibly cause the change you just observed? O A fall in interest rates A fall in labor taxes A rise in interest rates A rise in labor taxes The following graph shows the long-run aggregate supply (LRAS) curve of the economy when it is operating at Point A. PRICE LEVEL If the change previously identified affects the LRAS curve, shift the curve in the correct direction to reflect this change. LRAS REAL GDP (Q) LRAS (?) Grade It Now Save & Continue Continue without saving
Step by Step Solution
3.52 Rating (152 Votes )
There are 3 Steps involved in it
SOLUTION QUESTION 1 Q20546 is the correct option Because clearly we can see from the g... View full answer

Get step-by-step solutions from verified subject matter experts