

Question: 2 questions e Edit Format Tools Help F Q Q List Paragr.. Calibri 12 BIU AA. 5. The table below shows the number of women
2 questions
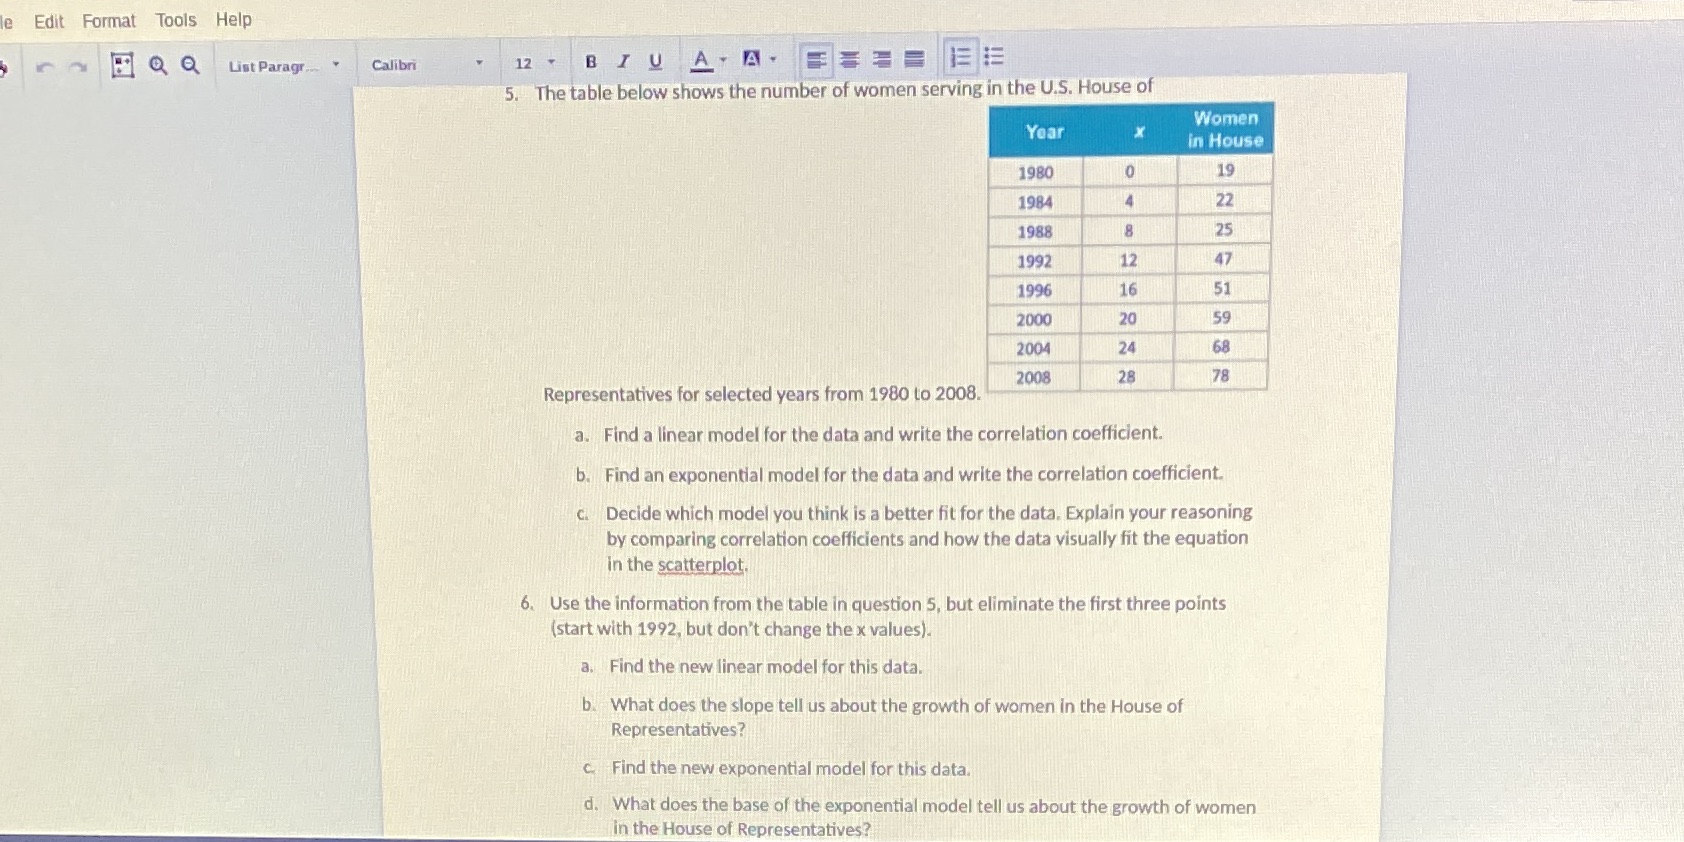
e Edit Format Tools Help F Q Q List Paragr.. Calibri 12 BIU AA. 5. The table below shows the number of women serving in the U.S. House of Women Year X in House 1980 0 19 1984 22 1988 8 25 1992 12 47 1996 16 51 2000 20 59 2004 24 68 2008 28 78 Representatives for selected years from 1980 to 2008. a. Find a linear model for the data and write the correlation coefficient. b. Find an exponential model for the data and write the correlation coefficient. c. Decide which model you think is a better fit for the data. Explain your reasoning by comparing correlation coefficients and how the data visually fit the equation in the scatterplot. 6. Use the information from the table in question 5, but eliminate the first three points (start with 1992, but don't change the x values). a. Find the new linear model for this data. b. What does the slope tell us about the growth of women in the House of Representatives? c. Find the new exponential model for this data. d. What does the base of the exponential model tell us about the growth of women in the House of Representatives
Step by Step Solution
There are 3 Steps involved in it

Get step-by-step solutions from verified subject matter experts