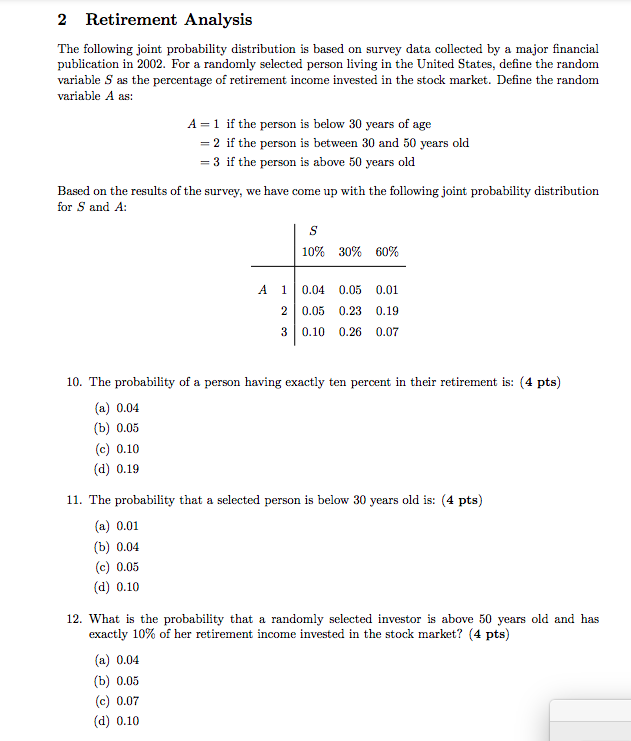
Question: 2 Retirement Analysis The following joint probability distribution is based on survey data collected by a major financial publication in 2002. For a randomly selected

2 Retirement Analysis The following joint

2 Retirement Analysis The following joint probability distribution is based on survey data collected by a major financial publication in 2002. For a randomly selected person living in the United States, define the random variable S as the percentage of retirement income invested in the stock market. Define the random variable A as: A=1 if the person is below 30 years of age = 2 if the person is between 30 and 50 years old = 3 if the person is above 50 years old Based on the results of the survey, we have come up with the following joint probability distribution for S and A: S 10% 30% 60% 1 0.04 0.05 0.01 2 0.05 0.23 0.19 0.26 0.07 3 0.10 10. The probability of a person having exactly ten percent in their retirement is: (4 pts) (a) 0.04 (b) 0.05 (c) 0.10 (d) 0.19 11. The probability that a selected person is below 30 years old is: (4 pts) (a) 0.01 (b) 0.04 (c) 0.05 (d) 0.10 12. What is the probability that a randomly selected investor is above 50 years old and has exactly 10% of her retirement income invested in the stock market? (4 pts) (a) 0.04 (b) 0.05 (c) 0.07 (d) 0.10

Step by Step Solution

There are 3 Steps involved in it

1 Expert Approved Answer
Step: 1 Unlock blur-text-image
Question Has Been Solved by an Expert!

Get step-by-step solutions from verified subject matter experts

Step: 2 Unlock
Step: 3 Unlock

Students Have Also Explored These Related General Management Questions!