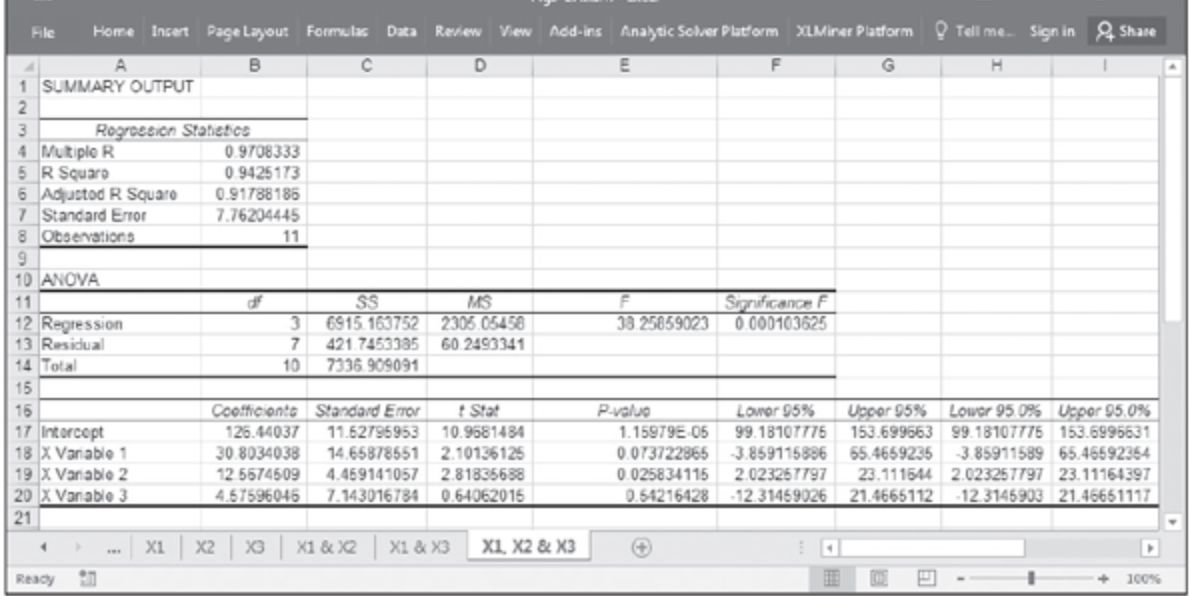
Question: 2. Share Filc Home Insert Page Layout Formulas Data Review View Add-ins Analytic Solver Platform XLMiner Platform Tell me. Sign in B D E F

2. Share Filc Home Insert Page Layout Formulas2. Share Filc Home Insert Page Layout Formulas

2. Share Filc Home Insert Page Layout Formulas Data Review View Add-ins Analytic Solver Platform XLMiner Platform Tell me. Sign in B D E F 1 SUMMARY OUTPUT 2 3 Rogression Statiesce 4 Mutiple R 0.9708333 5 R Squaro 0.9425173 6 Adjustod R Squaro 0.91788186 7 Standard Error 7.76204445 8 Observations 11 9 10 ANOVA 11 SS MS Significance F 12 Regression 3 6915. 163752 2305.05458 33 25859023 0.000103625 13 Residual 7 421.7453335 60.2493341 14 Total 10 7336.909091 15 15 Coofficiants Standard Error Stat P-value Lowor 95% Upcor 95% Lower 95.0% Uspor 95.0% 17 Intorcopt 126.44037 11.62795953 10.9581484 1.15979E 05 99.18107775 153.699663 99.18107776 153.6995631 18 X Variable 1 30 8034038 14.65878551 2.10136125 0.073722865 3.859115836 65.4659235 3.85911589 65.46592354 19 X Vanablo 2 12 5674509 4.459141057 2.81835658 0.025834115 2.023267797 23.111544 2.023257797 23.11161397 20 X Vanablo 3 4.67596046 7.143016784 0.64062015 0.51216428 .12.31469026 21.4665112 12.3145903 21.46661117 21 X1 X2 XO X1 & X X1 & X3 X1 X2 & X3 Recy 100% On Page 475, follow the Section 9.13.7 to generate the results of Figure 9.23. To complete your task, you may need to read and understand the previous sections. Create a text box and answer the following questions: 1. Explain the Adjusted-R-squared value 2. What is the estimted price of a house with 2000 sq. feet, 2 garages, and 3 bedrooms? Answer this question with an equation. In your Excel file, you should have only four worksheets: X1, X2, X3, and (X1-2-3). Save the file as 2. Share Filc Home Insert Page Layout Formulas Data Review View Add-ins Analytic Solver Platform XLMiner Platform Tell me. Sign in B D E F 1 SUMMARY OUTPUT 2 3 Rogression Statiesce 4 Mutiple R 0.9708333 5 R Squaro 0.9425173 6 Adjustod R Squaro 0.91788186 7 Standard Error 7.76204445 8 Observations 11 9 10 ANOVA 11 SS MS Significance F 12 Regression 3 6915. 163752 2305.05458 33 25859023 0.000103625 13 Residual 7 421.7453335 60.2493341 14 Total 10 7336.909091 15 15 Coofficiants Standard Error Stat P-value Lowor 95% Upcor 95% Lower 95.0% Uspor 95.0% 17 Intorcopt 126.44037 11.62795953 10.9581484 1.15979E 05 99.18107775 153.699663 99.18107776 153.6995631 18 X Variable 1 30 8034038 14.65878551 2.10136125 0.073722865 3.859115836 65.4659235 3.85911589 65.46592354 19 X Vanablo 2 12 5674509 4.459141057 2.81835658 0.025834115 2.023267797 23.111544 2.023257797 23.11161397 20 X Vanablo 3 4.67596046 7.143016784 0.64062015 0.51216428 .12.31469026 21.4665112 12.3145903 21.46661117 21 X1 X2 XO X1 & X X1 & X3 X1 X2 & X3 Recy 100% On Page 475, follow the Section 9.13.7 to generate the results of Figure 9.23. To complete your task, you may need to read and understand the previous sections. Create a text box and answer the following questions: 1. Explain the Adjusted-R-squared value 2. What is the estimted price of a house with 2000 sq. feet, 2 garages, and 3 bedrooms? Answer this question with an equation. In your Excel file, you should have only four worksheets: X1, X2, X3, and (X1-2-3). Save the file as

Step by Step Solution

There are 3 Steps involved in it

1 Expert Approved Answer
Step: 1 Unlock blur-text-image
Question Has Been Solved by an Expert!

Get step-by-step solutions from verified subject matter experts

Step: 2 Unlock
Step: 3 Unlock

Students Have Also Explored These Related General Management Questions!