

Question: 2. (SHOW YOUR COMPLETE WORK) A project network is shown below, with three time estimates (Optimistic Time-Most Likely Time-Pessimistic Time (in weeks)) for each activity
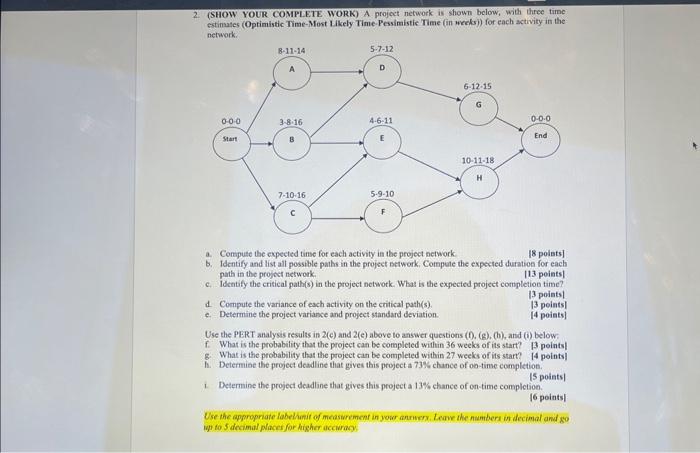
2. (SHOW YOUR COMPLETE WORK) A project network is shown below, with three time estimates (Optimistic Time-Most Likely Time-Pessimistic Time (in weeks)) for each activity in the network. a. Conpute the expected tine for each activity in the project network [8 poists] b. Identify and list alt possible paths in the project betwork, Compute the expected durntion for each path in the project network. [13 points] c. Identify the critical path(s) in the project network. What is the expecied project completion time? 1. Compute the variance of each activity on the critical path(s). |3 points| c. Defermine the project variance and project standard deviation. |3 peints| [4 poists] Use the PERT analysis results in 2(c) and 2(e) above to answer questions (f),(g),(b), and (c) below: f. What is the probability that the project can be completed within 36 weeks of its start? [3 points] 8. What is the probability that the project can be completed within 27 weeks of its start? [4 points] h. Determine the project desdline that gives this project it 73% chance of on-time completion. [S points| 1. Determine the project deadline that gives this project a 13% chance of on-time completion. |6 points] Use the appropriate labehinit of measwrement in jow auruer. Leave the numbers is ilecimal and so up to 5 decimal places for higher acciving
Step by Step Solution
There are 3 Steps involved in it

Get step-by-step solutions from verified subject matter experts