

Question: 2. Sketch the graph of each given function by doing the following (box your answer to each of the questions) 1. Determine the domain
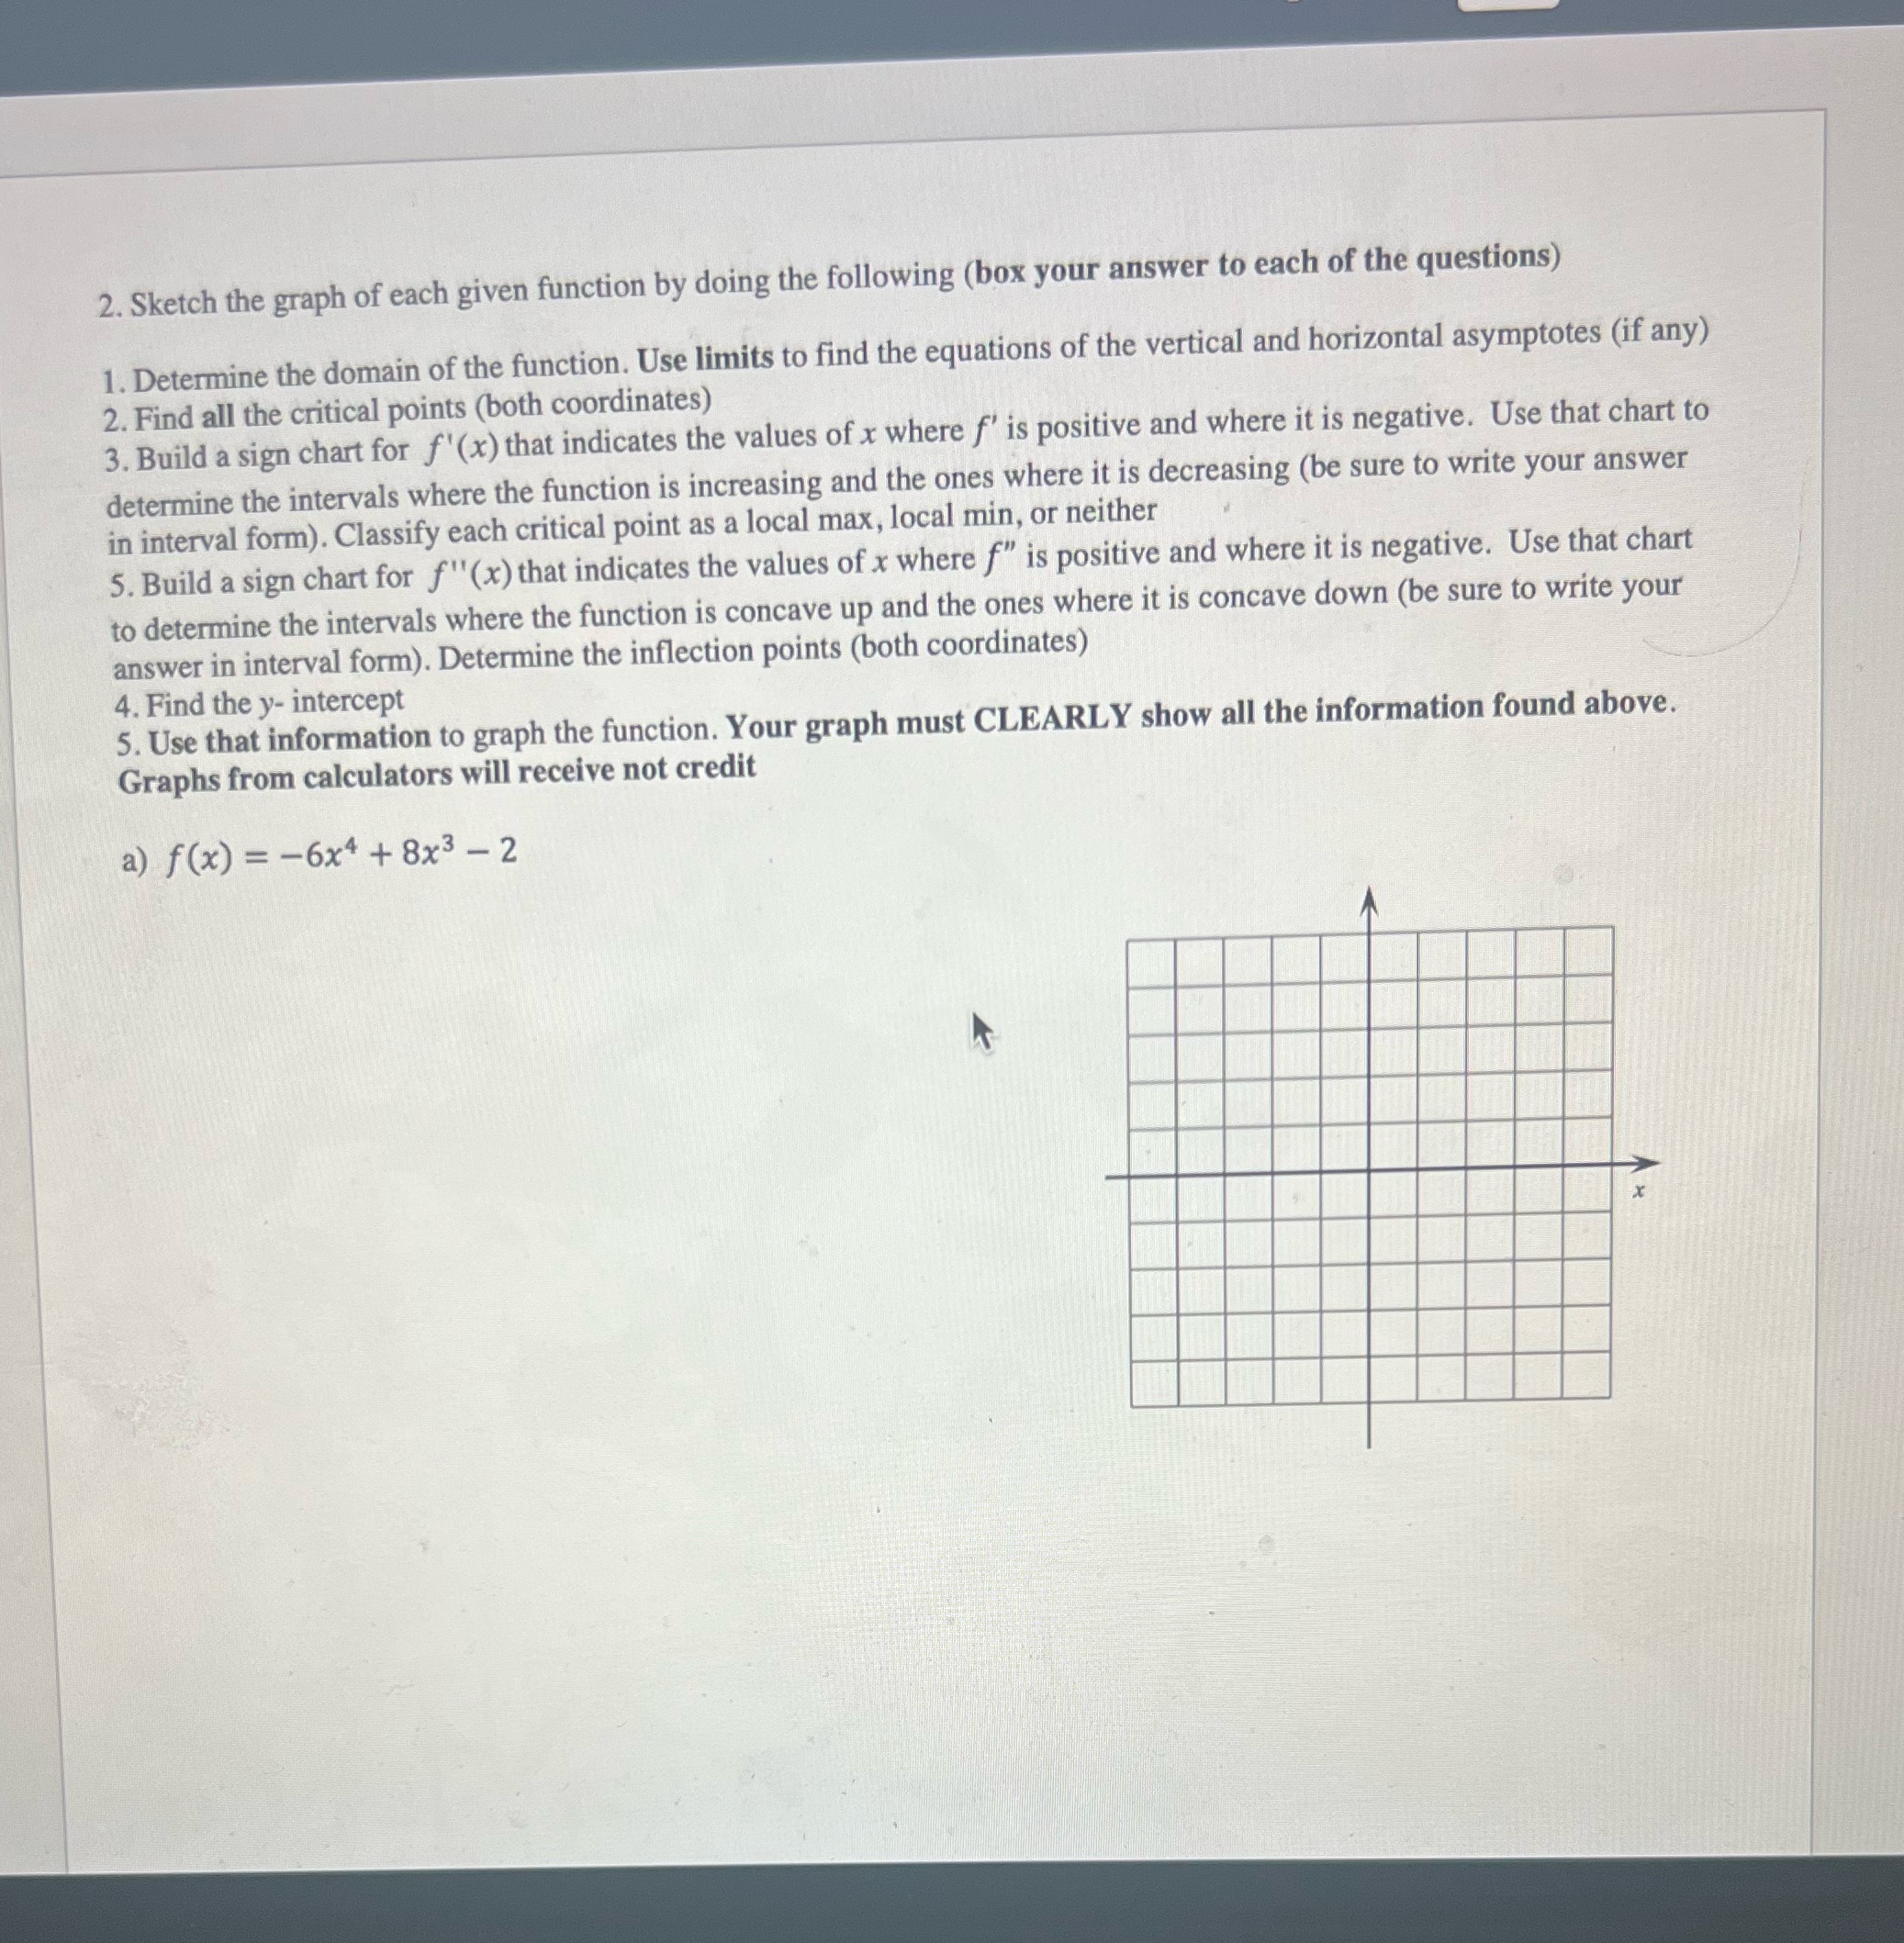
2. Sketch the graph of each given function by doing the following (box your answer to each of the questions) 1. Determine the domain of the function. Use limits to find the equations of the vertical and horizontal asymptotes (if any) 2. Find all the critical points (both coordinates) 3. Build a sign chart for f'(x) that indicates the values of x where f' is positive and where it is negative. Use that chart to determine the intervals where the function is increasing and the ones where it is decreasing (be sure to write your answer in interval form). Classify each critical point as a local max, local min, or neither 5. Build a sign chart for f'(x) that indicates the values of x where f" is positive and where it is negative. Use that chart to determine the intervals where the function is concave up and the ones where it is concave down (be sure to write your answer in interval form). Determine the inflection points (both coordinates) 4. Find the y-intercept 5. Use that information to graph the function. Your graph must CLEARLY show all the information found above. Graphs from calculators will receive not credit a) f(x)=-6x+8x-2 X
Step by Step Solution
There are 3 Steps involved in it

Get step-by-step solutions from verified subject matter experts