

2 Starbucks Consolidated Balance Sheet 3 (In millions of dollars) 4 2023 Percent 2022 Percent 2021...
Fantastic news! We've Found the answer you've been seeking!
Question:
Transcribed Image Text:
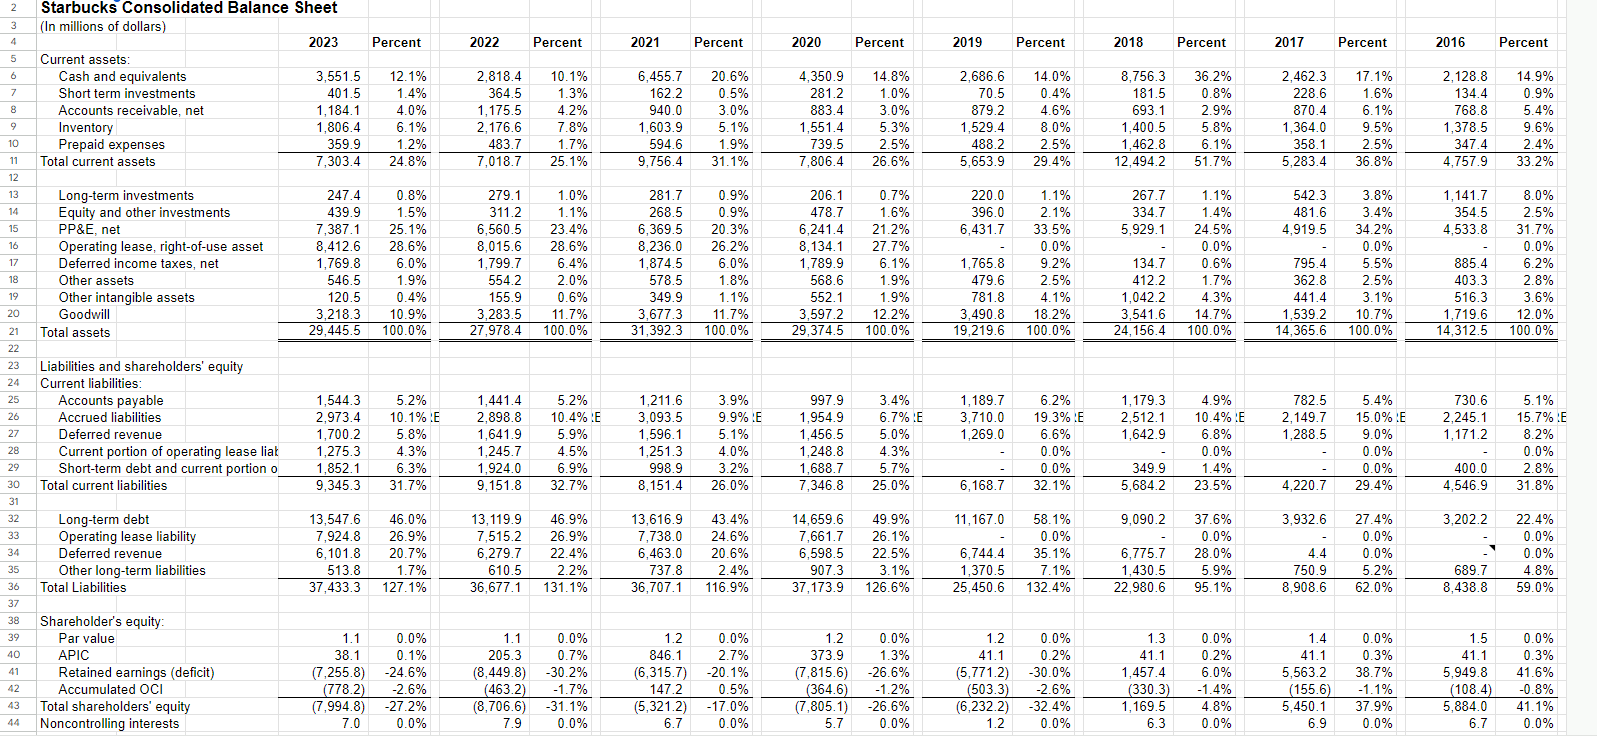
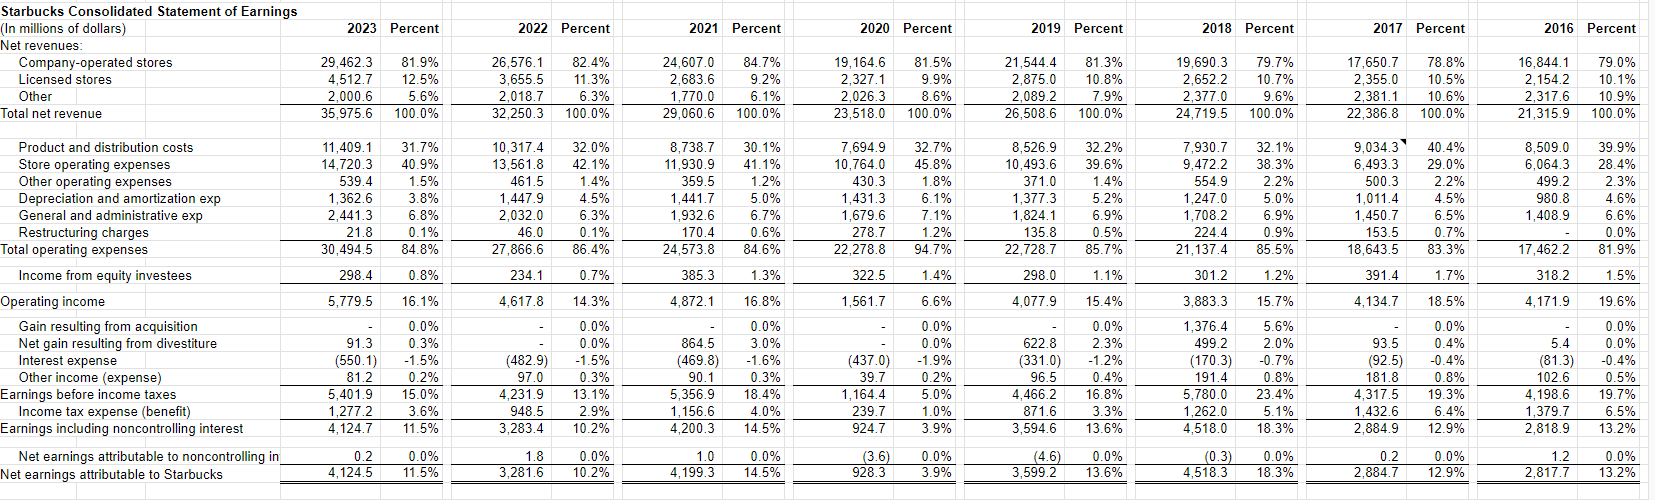
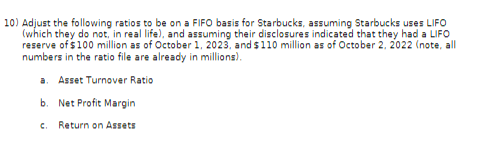
2 Starbucks Consolidated Balance Sheet 3 (In millions of dollars) 4 2023 Percent 2022 Percent 2021 Percent 2020 Percent 2019 Percent 2018 Percent 2017 Percent 2016 Percent 5 Current assets: 6 Cash and equivalents 3,551.5 12.1% 7 Short term investments 401.5 1.4% 2,818.4 10.1% 364.5 1.3% 162.2 6,455.7 20.6% 0.5% 281.2 4,350.9 14.8% 1.0% 8 Accounts receivable, net 1,184.1 4.0% 1,175.5 4.2% 940.0 3.0% 883.4 3.0% 879.2 2,686.6 14.0% 70.5 0.4% 4.6% 8,756.3 36.2% 2,462.3 17.1% 2,128.8 14.9% 181.5 0.8% 228.6 1.6% 134.4 0.9% 693.1 2.9% 870.4 6.1% 768.8 5.4% 9 Inventory 1,806.4 6.1% 2,176.6 7.8% 1,603.9 5.1% 1,551.4 5.3% 1,529.4 8.0% 1,400.5 5.8% 1,364.0 9.5% 1,378.5 9.6% 10 Prepaid expenses 359.9 1.2% 483.7 1.7% 594.6 1.9% 739.5 2.5% 488.2 2.5% 1,462.8 6.1% 358.1 2.5% 347.4 2.4% 11 Total current assets 7,303.4 24.8% 7,018.7 25.1% 9,756.4 31.1% 7,806.4 26.6% 5,653.9 29.4% 12,494.2 51.7% 5,283.4 36.8% 4,757.9 33.2% 12 13 Long-term investments 247.4 0.8% 279.1 1.0% 281.7 0.9% 206.1 0.7% 14 Equity and other investments 439.9 1.5% 311.2 1.1% 268.5 0.9% 15 PP&E, net 7,387.1 25.1% 6,560.5 23.4% 6,369.5 20.3% 478.7 1.6% 6,241.4 21.2% 220.0 396.0 6,431.7 33.5% 1.1% 267.7 1.1% 542.3 3.8% 1,141.7 8.0% 2.1% 334.7 1.4% 481.6 3.4% 354.5 2.5% 5,929.1 24.5% 4,919.5 34.2% 4,533.8 31.7% 16 Operating lease, right-of-use asset 8,412.6 28.6% 8,015.6 28.6% 8,236.0 26.2% 8,134.1 27.7% - 0.0% 0.0% 0.0% 0.0% 17 Deferred income taxes, net 1,769.8 6.0% 1,799.7 6.4% 1,874.5 6.0% 1,789.9 6.1% 1,765.8 9.2% 134.7 0.6% 795.4 5.5% 885.4 6.2% 18 Other assets 546.5 1.9% 554.2 2.0% 578.5 1.8% 568.6 1.9% 479.6 2.5% 412.2 1.7% 362.8 2.5% 403.3 2.8% 19 Other intangible assets 120.5 0.4% 155.9 0.6% 349.9 1.1% 552.1 1.9% 781.8 4.1% 1,042.2 4.3% 441.4 3.1% 516.3 3.6% 20 Goodwill 3,218.3 10.9% 3,283.5 11.7% 3,677.3 11.7% 21 Total assets 29,445.5 100.0% 27,978.4 100.0% 31,392.3 100.0% 3,597.2 12.2% 29,374.5 100.0% 3,490.8 18.2% 19,219.6 100.0% 3,541.6 14.7% 24,156.4 100.0% 1,539.2 10.7% 1,719.6 12.0% 14,365.6 100.0% 14,312.5 100.0% 22 23 Liabilities and shareholders' equity 24 Current liabilities: 25 Accounts payable 1,544.3 5.2% 1,441.4 5.2% 1,211.6 3.9% 997.9 3.4% 1,189.7 6.2% 1,179.3 4.9% 782.5 5.4% 730.6 5.1% 26 Accrued liabilities 2,973.4 10.1% E 2,898.8 10.4% E 3,093.5 9.9% E 1,954.9 6.7% E 3,710.0 19.3% E 2,512.1 10.4% E 2,149.7 15.0% E 2,245.1 15.7% E 27 Deferred revenue 1,700.2 5.8% 1,641.9 5.9% 1,596.1 5.1% 1,456.5 5.0% 1,269.0 6.6% 1,642.9 6.8% 1,288.5 9.0% 1,171.2 8.2% 28 Current portion of operating lease liab 1,275.3 4.3% 1,245.7 4.5% 1,251.3 4.0% 1,248.8 4.3% 0.0% 0.0% 0.0% - 0.0% 29 Short-term debt and current portion o 1,852.1 30 Total current liabilities 6.3% 9,345.3 31.7% 1,924.0 6.9% 9,151.8 32.7% 998.9 3.2% 1,688.7 5.7% 0.0% 349.9 1.4% 0.0% 400.0 2.8% 8,151.4 26.0% 7,346.8 25.0% 6,168.7 32.1% 5,684.2 23.5% 4,220.7 29.4% 4,546.9 31.8% 31 32 Long-term debt 13,547.6 46.0% 33 Operating lease liability 34 Deferred revenue 35 Other long-term liabilities 36 Total Liabilities 37,433.3 7,924.8 26.9% 6,101.8 20.7% 513.8 1.7% 127.1% 13,119.9 46.9% 7,515.2 26.9% 6,279.7 610.5 36,677.1 13,616.9 43.4% 14,659.6 49.9% 11,167.0 7,738.0 24.6% 7,661.7 26.1% 58.1% 0.0% 9,090.2 37.6% 3,932.6 27.4% 3,202.2 22.4% 0.0% 0.0% 0.0% 22.4% 6,463.0 20.6% 6,598.5 22.5% 2.2% 131.1% 737.8 36,707.1 2.4% 116.9% 907.3 37,173.9 3.1% 126.6% 6,744.4 1,370.5 25,450.6 35.1% 7.1% 132.4% 6,775.7 28.0% 1,430.5 5.9% 22,980.6 95.1% 4.4 0.0% 0.0% 750.9 8,908.6 5.2% 689.7 4.8% 62.0% 8,438.8 59.0% 37 38 Shareholder's equity: 39 Par value 40 APIC 1.1 38.1 41 Retained earnings (deficit) (7,255.8) 42 Accumulated OCI (778.2) 0.0% 0.1% -24.6% -2.6% 43 Total shareholders' equity (7,994.8) 44 Noncontrolling interests 7.0 -27.2% 0.0% 1.1 205.3 (8,449.8) (463.2) (8,706.6) 7.9 0.0% 0.7% -30.2% -1.7% -31.1% 0.0% 1.2 846.1 (6,315.7) 147.2 (5,321.2) 6.7 0.0% 2.7% -20.1% 0.5% -17.0% 0.0% 1.2 373.9 (7,815.6) (364.6) (7,805.1) 5.7 0.0% 1.3% -26.6% -1.2% -26.6% 0.0% 1.2 41.1 (5,771.2) (503.3) (6,232.2) 0.0% 0.2% -30.0% -2.6% -32.4% 1.3 0.0% 1.4 0.0% 1.5 0.0% 41.1 0.2% 41.1 0.3% 41.1 0.3% 1,457.4 6.0% 5,563.2 38.7% 5,949.8 41.6% (330.3) -1.4% (155.6) -1.1% (108.4) -0.8% 1,169.5 4.8% 5,450.1 37.9% 5,884.0 41.1% 1.2 0.0% 6.3 0.0% 6.9 0.0% 6.7 0.0% Starbucks Consolidated Statement of Earnings (In millions of dollars) Net revenues: Company-operated stores Licensed stores Other Total net revenue 2023 Percent 2022 Percent 2021 Percent 2020 Percent 2019 Percent 2018 Percent 2017 Percent 2016 Percent 29,462.3 81.9% 4,512.7 12.5% 2,000.6 5.6% 35,975.6 100.0% 26,576.1 82.4% 3,655.5 11.3% 2,018.7 6.3% 32,250.3 100.0% 24,607.0 84.7% 2,683.6 9.2% 1,770.0 6.1% 29,060.6 100.0% 19,164.6 81.5% 2,327.1 9.9% 2,026.3 8.6% 23,518.0 100.0% 21,544.4 81.3% 2,875.0 10.8% 2,089.2 7.9% 26,508.6 100.0% 19,690.3 79.7% 2,652.2 10.7% 2,377.0 9.6% 24,719.5 100.0% 17,650.7 78.8% 2,355.0 10.5% 2,381.1 10.6% 22,386.8 100.0% 16,844.1 79.0% 2,154.2 10.1% 2,317.6 10.9% 21,315.9 100.0% Product and distribution costs 11,409.1 31.7% Store operating expenses 14,720.3 40.9% 10,317.4 32.0% 13,561.8 42.1% 8,738.7 30.1% 11,930.9 41.1% 7,694.9 32.7% 8,526.9 32.2% 7,930.7 32.1% 9,034.3 40.4% 8,509.0 39.9% 10,764.0 45.8% 10,493.6 39.6% 9,472.2 38.3% 6,493.3 29.0% 6,064.3 28.4% Other operating expenses 539.4 1.5% 461.5 1.4% 359.5 1.2% 430.3 1.8% 371.0 1.4% 554.9 2.2% 500.3 2.2% 499.2 2.3% Depreciation and amortization exp 1,362.6 3.8% 1,447.9 4.5% 1,441.7 5.0% 1,431.3 6.1% 1,377.3 5.2% 1,247.0 5.0% 1,011.4 4.5% 980.8 4.6% General and administrative exp 2,441.3 6.8% 2,032.0 6.3% 1,932.6 6.7% 1,679.6 7.1% 1,824.1 6.9% 1,708.2 6.9% 1,450.7 6.5% 1,408.9 6.6% Restructuring charges 21.8 0.1% Total operating expenses 30,494.5 84.8% 46.0 27,866.6 0.1% 170.4 0.6% 278.7 1.2% 135.8 0.5% 224.4 0.9% 153.5 0.7% 0.0% 86.4% 24,573.8 84.6% 22,278.8 94.7% 22,728.7 85.7% 21,137.4 85.5% 18,643.5 83.3% 17,462.2 81.9% Income from equity investees 298.4 0.8% 234.1 0.7% 385.3 1.3% 322.5 1.4% 298.0 1.1% 301.2 1.2% 391.4 1.7% 318.2 1.5% Operating income 5,779.5 16.1% 4,617.8 14.3% 4,872.1 16.8% 1,561.7 6.6% 4,077.9 15.4% 3,883.3 15.7% 4,134.7 18.5% 4,171.9 19.6% Gain resulting from acquisition 0.0% 0.0% 0.0% 0.0% 0.0% 1,376.4 5.6% 0.0% 0.0% Net gain resulting from divestiture 91.3 0.3% 0.0% 864.5 3.0% 0.0% 622.8 2.3% 499.2 2.0% 93.5 0.4% 5.4 0.0% Interest expense (550.1) -1.5% (482.9) -1.5% Other income (expense) 81.2 Earnings before income taxes 5,401.9 Income tax expense (benefit) 1,277.2 Earnings including noncontrolling interest 4,124.7 0.2% 15.0% 3.6% 11.5% 97.0 0.3% 4,231.9 13.1% 948.5 2.9% 3,283.4 10.2% (469.8) -1.6% 90.1 5,356.9 1,156.6 4,200.3 (437.0) -1.9% 0.3% 18.4% 4.0% 14.5% 39.7 0.2% 1,164.4 5.0% 239.7 1.0% 871.6 924.7 3.9% 3,594.6 (331.0) -1.2% 96.5 0.4% 4,466.2 16.8% 3.3% 13.6% 4,518.0 (170.3) -0.7% 191.4 0.8% 5,780.0 23.4% 1,262.0 5.1% 18.3% (92.5) -0.4% (81.3) -0.4% 181.8 0.8% 102.6 0.5% 4,317.5 19.3% 4,198.6 19.7% 1,432.6 6.4% 1,379.7 6.5% 2,884.9 12.9% 2,818.9 13.2% Net earnings attributable to noncontrolling in 0.2 Net earnings attributable to Starbucks 4,124.5 0.0% 11.5% 1.8 3,281.6 0.0% 10.2% 1.0 4,199.3 0.0% (3.6) 0.0% (4.6) 0.0% (0.3) 0.0% 14.5% 928.3 3.9% 3,599.2 13.6% 4,518.3 18.3% 0.2 2,884.7 0.0% 12.9% 1.2 2,817.7 0.0% 13.2% 10) Adjust the following ratios to be on a FIFO basis for Starbucks, assuming Starbucks uses LIFO (which they do not, in real life), and assuming their disclosures indicated that they had a LIFO reserve of $100 million as of October 1, 2023, and $110 million as of October 2, 2022 (note, all numbers in the ratio file are already in millions). a. Asset Turnover Ratio b. Net Profit Margin c. Return on Assets 2 Starbucks Consolidated Balance Sheet 3 (In millions of dollars) 4 2023 Percent 2022 Percent 2021 Percent 2020 Percent 2019 Percent 2018 Percent 2017 Percent 2016 Percent 5 Current assets: 6 Cash and equivalents 3,551.5 12.1% 7 Short term investments 401.5 1.4% 2,818.4 10.1% 364.5 1.3% 162.2 6,455.7 20.6% 0.5% 281.2 4,350.9 14.8% 1.0% 8 Accounts receivable, net 1,184.1 4.0% 1,175.5 4.2% 940.0 3.0% 883.4 3.0% 879.2 2,686.6 14.0% 70.5 0.4% 4.6% 8,756.3 36.2% 2,462.3 17.1% 2,128.8 14.9% 181.5 0.8% 228.6 1.6% 134.4 0.9% 693.1 2.9% 870.4 6.1% 768.8 5.4% 9 Inventory 1,806.4 6.1% 2,176.6 7.8% 1,603.9 5.1% 1,551.4 5.3% 1,529.4 8.0% 1,400.5 5.8% 1,364.0 9.5% 1,378.5 9.6% 10 Prepaid expenses 359.9 1.2% 483.7 1.7% 594.6 1.9% 739.5 2.5% 488.2 2.5% 1,462.8 6.1% 358.1 2.5% 347.4 2.4% 11 Total current assets 7,303.4 24.8% 7,018.7 25.1% 9,756.4 31.1% 7,806.4 26.6% 5,653.9 29.4% 12,494.2 51.7% 5,283.4 36.8% 4,757.9 33.2% 12 13 Long-term investments 247.4 0.8% 279.1 1.0% 281.7 0.9% 206.1 0.7% 14 Equity and other investments 439.9 1.5% 311.2 1.1% 268.5 0.9% 15 PP&E, net 7,387.1 25.1% 6,560.5 23.4% 6,369.5 20.3% 478.7 1.6% 6,241.4 21.2% 220.0 396.0 6,431.7 33.5% 1.1% 267.7 1.1% 542.3 3.8% 1,141.7 8.0% 2.1% 334.7 1.4% 481.6 3.4% 354.5 2.5% 5,929.1 24.5% 4,919.5 34.2% 4,533.8 31.7% 16 Operating lease, right-of-use asset 8,412.6 28.6% 8,015.6 28.6% 8,236.0 26.2% 8,134.1 27.7% - 0.0% 0.0% 0.0% 0.0% 17 Deferred income taxes, net 1,769.8 6.0% 1,799.7 6.4% 1,874.5 6.0% 1,789.9 6.1% 1,765.8 9.2% 134.7 0.6% 795.4 5.5% 885.4 6.2% 18 Other assets 546.5 1.9% 554.2 2.0% 578.5 1.8% 568.6 1.9% 479.6 2.5% 412.2 1.7% 362.8 2.5% 403.3 2.8% 19 Other intangible assets 120.5 0.4% 155.9 0.6% 349.9 1.1% 552.1 1.9% 781.8 4.1% 1,042.2 4.3% 441.4 3.1% 516.3 3.6% 20 Goodwill 3,218.3 10.9% 3,283.5 11.7% 3,677.3 11.7% 21 Total assets 29,445.5 100.0% 27,978.4 100.0% 31,392.3 100.0% 3,597.2 12.2% 29,374.5 100.0% 3,490.8 18.2% 19,219.6 100.0% 3,541.6 14.7% 24,156.4 100.0% 1,539.2 10.7% 1,719.6 12.0% 14,365.6 100.0% 14,312.5 100.0% 22 23 Liabilities and shareholders' equity 24 Current liabilities: 25 Accounts payable 1,544.3 5.2% 1,441.4 5.2% 1,211.6 3.9% 997.9 3.4% 1,189.7 6.2% 1,179.3 4.9% 782.5 5.4% 730.6 5.1% 26 Accrued liabilities 2,973.4 10.1% E 2,898.8 10.4% E 3,093.5 9.9% E 1,954.9 6.7% E 3,710.0 19.3% E 2,512.1 10.4% E 2,149.7 15.0% E 2,245.1 15.7% E 27 Deferred revenue 1,700.2 5.8% 1,641.9 5.9% 1,596.1 5.1% 1,456.5 5.0% 1,269.0 6.6% 1,642.9 6.8% 1,288.5 9.0% 1,171.2 8.2% 28 Current portion of operating lease liab 1,275.3 4.3% 1,245.7 4.5% 1,251.3 4.0% 1,248.8 4.3% 0.0% 0.0% 0.0% - 0.0% 29 Short-term debt and current portion o 1,852.1 30 Total current liabilities 6.3% 9,345.3 31.7% 1,924.0 6.9% 9,151.8 32.7% 998.9 3.2% 1,688.7 5.7% 0.0% 349.9 1.4% 0.0% 400.0 2.8% 8,151.4 26.0% 7,346.8 25.0% 6,168.7 32.1% 5,684.2 23.5% 4,220.7 29.4% 4,546.9 31.8% 31 32 Long-term debt 13,547.6 46.0% 33 Operating lease liability 34 Deferred revenue 35 Other long-term liabilities 36 Total Liabilities 37,433.3 7,924.8 26.9% 6,101.8 20.7% 513.8 1.7% 127.1% 13,119.9 46.9% 7,515.2 26.9% 6,279.7 610.5 36,677.1 13,616.9 43.4% 14,659.6 49.9% 11,167.0 7,738.0 24.6% 7,661.7 26.1% 58.1% 0.0% 9,090.2 37.6% 3,932.6 27.4% 3,202.2 22.4% 0.0% 0.0% 0.0% 22.4% 6,463.0 20.6% 6,598.5 22.5% 2.2% 131.1% 737.8 36,707.1 2.4% 116.9% 907.3 37,173.9 3.1% 126.6% 6,744.4 1,370.5 25,450.6 35.1% 7.1% 132.4% 6,775.7 28.0% 1,430.5 5.9% 22,980.6 95.1% 4.4 0.0% 0.0% 750.9 8,908.6 5.2% 689.7 4.8% 62.0% 8,438.8 59.0% 37 38 Shareholder's equity: 39 Par value 40 APIC 1.1 38.1 41 Retained earnings (deficit) (7,255.8) 42 Accumulated OCI (778.2) 0.0% 0.1% -24.6% -2.6% 43 Total shareholders' equity (7,994.8) 44 Noncontrolling interests 7.0 -27.2% 0.0% 1.1 205.3 (8,449.8) (463.2) (8,706.6) 7.9 0.0% 0.7% -30.2% -1.7% -31.1% 0.0% 1.2 846.1 (6,315.7) 147.2 (5,321.2) 6.7 0.0% 2.7% -20.1% 0.5% -17.0% 0.0% 1.2 373.9 (7,815.6) (364.6) (7,805.1) 5.7 0.0% 1.3% -26.6% -1.2% -26.6% 0.0% 1.2 41.1 (5,771.2) (503.3) (6,232.2) 0.0% 0.2% -30.0% -2.6% -32.4% 1.3 0.0% 1.4 0.0% 1.5 0.0% 41.1 0.2% 41.1 0.3% 41.1 0.3% 1,457.4 6.0% 5,563.2 38.7% 5,949.8 41.6% (330.3) -1.4% (155.6) -1.1% (108.4) -0.8% 1,169.5 4.8% 5,450.1 37.9% 5,884.0 41.1% 1.2 0.0% 6.3 0.0% 6.9 0.0% 6.7 0.0% Starbucks Consolidated Statement of Earnings (In millions of dollars) Net revenues: Company-operated stores Licensed stores Other Total net revenue 2023 Percent 2022 Percent 2021 Percent 2020 Percent 2019 Percent 2018 Percent 2017 Percent 2016 Percent 29,462.3 81.9% 4,512.7 12.5% 2,000.6 5.6% 35,975.6 100.0% 26,576.1 82.4% 3,655.5 11.3% 2,018.7 6.3% 32,250.3 100.0% 24,607.0 84.7% 2,683.6 9.2% 1,770.0 6.1% 29,060.6 100.0% 19,164.6 81.5% 2,327.1 9.9% 2,026.3 8.6% 23,518.0 100.0% 21,544.4 81.3% 2,875.0 10.8% 2,089.2 7.9% 26,508.6 100.0% 19,690.3 79.7% 2,652.2 10.7% 2,377.0 9.6% 24,719.5 100.0% 17,650.7 78.8% 2,355.0 10.5% 2,381.1 10.6% 22,386.8 100.0% 16,844.1 79.0% 2,154.2 10.1% 2,317.6 10.9% 21,315.9 100.0% Product and distribution costs 11,409.1 31.7% Store operating expenses 14,720.3 40.9% 10,317.4 32.0% 13,561.8 42.1% 8,738.7 30.1% 11,930.9 41.1% 7,694.9 32.7% 8,526.9 32.2% 7,930.7 32.1% 9,034.3 40.4% 8,509.0 39.9% 10,764.0 45.8% 10,493.6 39.6% 9,472.2 38.3% 6,493.3 29.0% 6,064.3 28.4% Other operating expenses 539.4 1.5% 461.5 1.4% 359.5 1.2% 430.3 1.8% 371.0 1.4% 554.9 2.2% 500.3 2.2% 499.2 2.3% Depreciation and amortization exp 1,362.6 3.8% 1,447.9 4.5% 1,441.7 5.0% 1,431.3 6.1% 1,377.3 5.2% 1,247.0 5.0% 1,011.4 4.5% 980.8 4.6% General and administrative exp 2,441.3 6.8% 2,032.0 6.3% 1,932.6 6.7% 1,679.6 7.1% 1,824.1 6.9% 1,708.2 6.9% 1,450.7 6.5% 1,408.9 6.6% Restructuring charges 21.8 0.1% Total operating expenses 30,494.5 84.8% 46.0 27,866.6 0.1% 170.4 0.6% 278.7 1.2% 135.8 0.5% 224.4 0.9% 153.5 0.7% 0.0% 86.4% 24,573.8 84.6% 22,278.8 94.7% 22,728.7 85.7% 21,137.4 85.5% 18,643.5 83.3% 17,462.2 81.9% Income from equity investees 298.4 0.8% 234.1 0.7% 385.3 1.3% 322.5 1.4% 298.0 1.1% 301.2 1.2% 391.4 1.7% 318.2 1.5% Operating income 5,779.5 16.1% 4,617.8 14.3% 4,872.1 16.8% 1,561.7 6.6% 4,077.9 15.4% 3,883.3 15.7% 4,134.7 18.5% 4,171.9 19.6% Gain resulting from acquisition 0.0% 0.0% 0.0% 0.0% 0.0% 1,376.4 5.6% 0.0% 0.0% Net gain resulting from divestiture 91.3 0.3% 0.0% 864.5 3.0% 0.0% 622.8 2.3% 499.2 2.0% 93.5 0.4% 5.4 0.0% Interest expense (550.1) -1.5% (482.9) -1.5% Other income (expense) 81.2 Earnings before income taxes 5,401.9 Income tax expense (benefit) 1,277.2 Earnings including noncontrolling interest 4,124.7 0.2% 15.0% 3.6% 11.5% 97.0 0.3% 4,231.9 13.1% 948.5 2.9% 3,283.4 10.2% (469.8) -1.6% 90.1 5,356.9 1,156.6 4,200.3 (437.0) -1.9% 0.3% 18.4% 4.0% 14.5% 39.7 0.2% 1,164.4 5.0% 239.7 1.0% 871.6 924.7 3.9% 3,594.6 (331.0) -1.2% 96.5 0.4% 4,466.2 16.8% 3.3% 13.6% 4,518.0 (170.3) -0.7% 191.4 0.8% 5,780.0 23.4% 1,262.0 5.1% 18.3% (92.5) -0.4% (81.3) -0.4% 181.8 0.8% 102.6 0.5% 4,317.5 19.3% 4,198.6 19.7% 1,432.6 6.4% 1,379.7 6.5% 2,884.9 12.9% 2,818.9 13.2% Net earnings attributable to noncontrolling in 0.2 Net earnings attributable to Starbucks 4,124.5 0.0% 11.5% 1.8 3,281.6 0.0% 10.2% 1.0 4,199.3 0.0% (3.6) 0.0% (4.6) 0.0% (0.3) 0.0% 14.5% 928.3 3.9% 3,599.2 13.6% 4,518.3 18.3% 0.2 2,884.7 0.0% 12.9% 1.2 2,817.7 0.0% 13.2% 10) Adjust the following ratios to be on a FIFO basis for Starbucks, assuming Starbucks uses LIFO (which they do not, in real life), and assuming their disclosures indicated that they had a LIFO reserve of $100 million as of October 1, 2023, and $110 million as of October 2, 2022 (note, all numbers in the ratio file are already in millions). a. Asset Turnover Ratio b. Net Profit Margin c. Return on Assets
Expert Answer:

Related Book For 

Financial Markets and Institutions
ISBN: 978-0077861667
6th edition
Authors: Anthony Saunders, Marcia Cornett
Posted Date:
Students also viewed these accounting questions
-
Use the attached "words.txt" file to store the words along with their ranks in an AVL tree. Then provide the user the option to search for any word. If the word exists the program displays the rank...
-
Integrate using an appropriate formula For each problem, state the formula number, u and du, identify any constants (if appropriate), and show any constant "adjustments" / "Multiply by 1" if needed....
-
The Electric Corporation, a publicly held corporation, owns land with a $1,600,000 basis that is being held for investment. The company is considering exchanging the land for two assets owned by the...
-
Benson, Inc., has sales of $38,530, costs of $12,750, depreciation expense of $2,550, and interest expense of $1,850. If the tax rate is 21 percent, what is the operating cash flow, or OCF?
-
Can you present a graphic that presents the payroll disbursement amounts by date for the contact employee who has been terminated but has been paid after termination (i.e., ghost employees)?
-
On pages 279-280 are statements of earnings and financial position for Wexler Industries. Required a. Use professional judgment in deciding on the preliminary judgment about materiality for earnings,...
-
Business Scenario The ABC corporation is a newly established company and the owner is looking for an efficient method of collecting, storing, and manipulating data. The corporation offers a variety...
-
Show that s is not natural parameter for the curve x(s) = (cos-s-s-s1-s, 1-s+1-s,0).
-
Consider a hypothetical using the 2002 numbers in Exhibit 2: if Linear paid out their entire cash balance as a special dividend at the beginning of 2002, what would be the effect on the value of the...
-
Calculate BHFP With Pressure Traverse Curves. Yg = 0.65. Pif = 160 psia. L = 12,000 ft. 500 STB/D. 90 9w=500 STB/D. 9g = 400 Mscf/D. 0 0 (vertical well). = d 2.441 inches (flow through tubing). T =...
-
Find out the Moore-Penrose inverse A+ for the matrix A 4 = | 1 1 0 11 -1 0
-
(a) GameStart Bhd., a toy manufacturer is planning to replenish its inventories and is considering the following options: Option Order Quantity (Units) Annual Demand (Units) Total Holding Cost (RM)...
-
5. Make a Poster how this formula 3Rs x 7Cs = 21st Century Learning direct to a successful learning in the 21st century. Post it in the class GC.
-
Supra's has sales of $919,800, total assets of $949,200, a profit margin of 7.3 percent, and a total debt ratio of 0.48. What is the return on equity?
-
Write a paper by answer the following question: Should Recycling Be Mandatory?
-
How is duration related to the interest elasticity of a fixed-income security? What is the relationship between duration and the price of the fixed-income security?
-
How does the amount of equity as a percentage of assets compare for finance companies and commercial banks? What accounts for the difference?
-
Identify the four characteristics or features of the perils insured against by property- casualty insurance. Rank the features in terms of actuarial predictability and total loss potential.
-
How are risk and return each defined? Do you think there is a relationship between them?
-
Describe the components of a business plan. How does each of these components help the following people to make decisions about a business? (a) An investor. (b) A creditor. (c) A manager or owner.
-
Define relevant range. Why is it important?

Study smarter with the SolutionInn App