

Question: Consider a hypothetical using the 2002 numbers in Exhibit 2: if Linear paid out their entire cash balance as a special dividend at the beginning
Consider a hypothetical using the 2002 numbers in Exhibit 2: if Linear paid out their entire cash balance as a special dividend at the beginning of 2002, what would be the effect on the value of the firm? On the share price? On earnings and EPS? What if they used all of the cash balance to do a share repurchase at the beginning of 2002 instead? (You can assume that Linear earns a 3.35% interest rate on their cash balance for your calculations.).
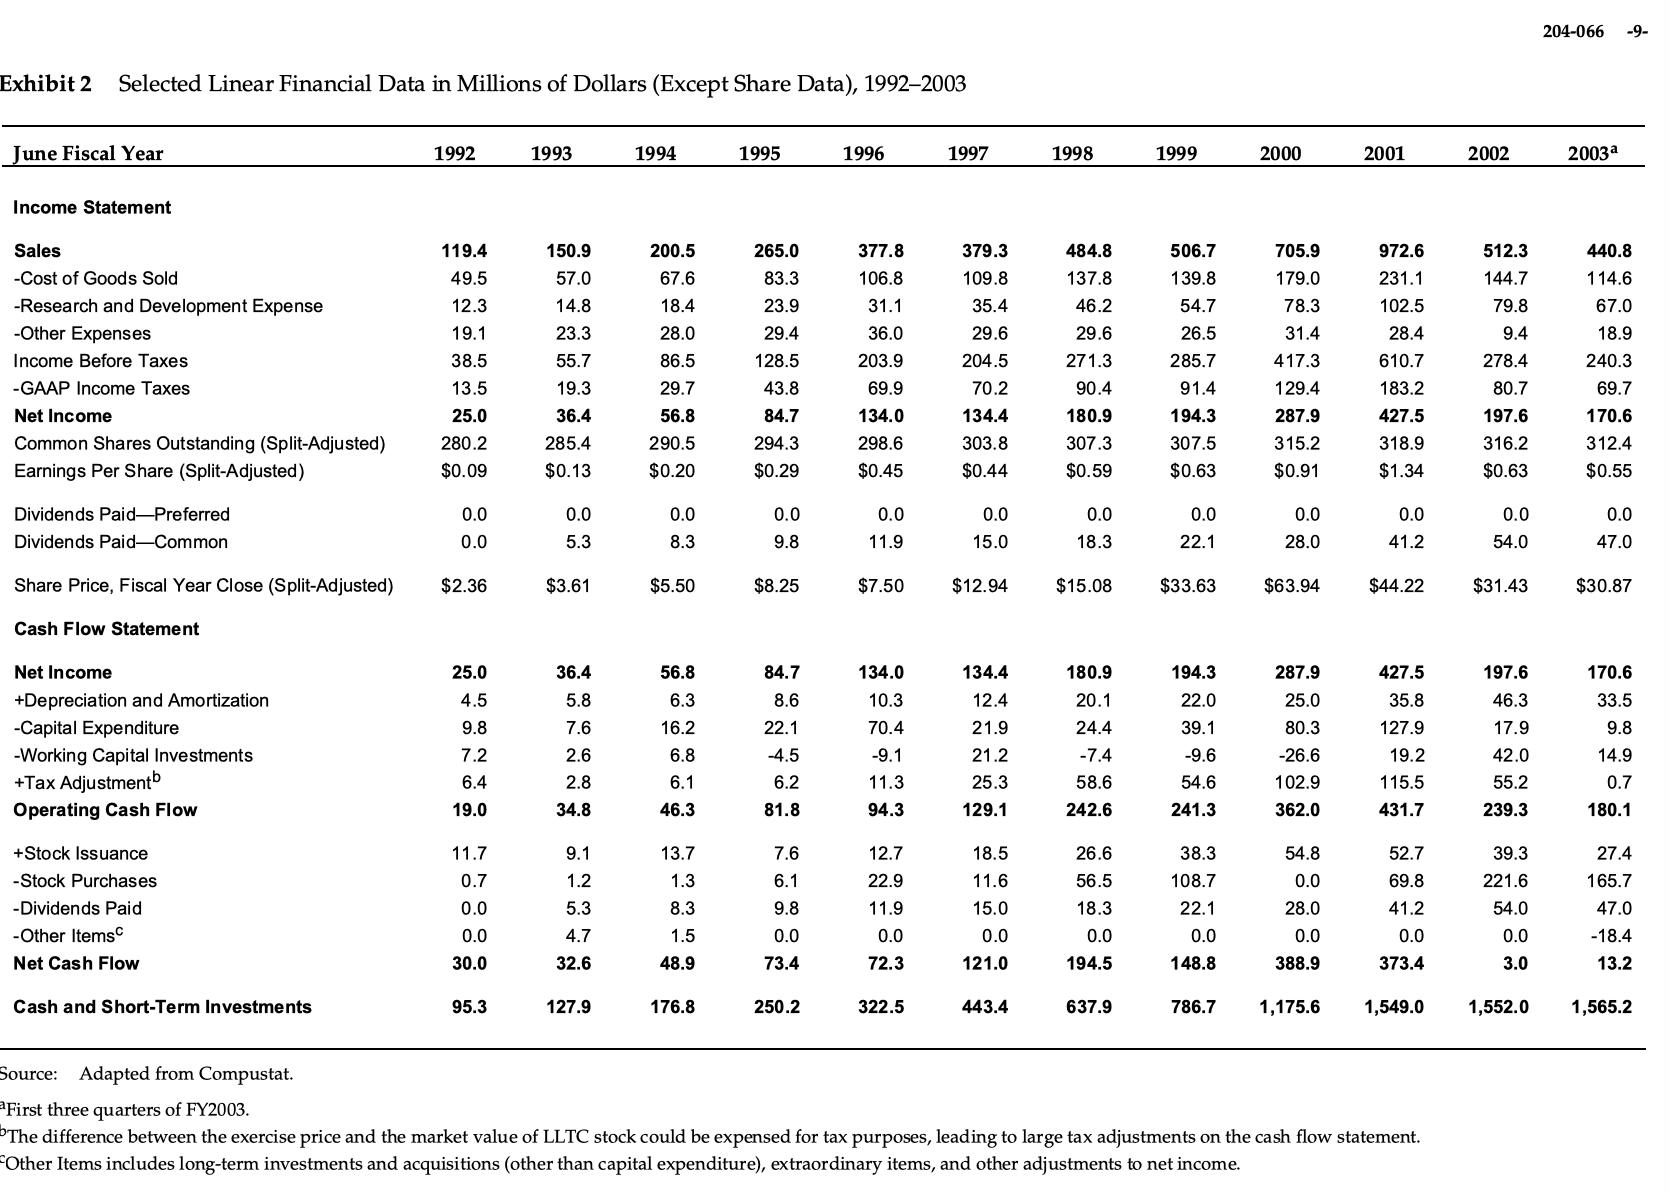
Exhibit 2 Selected Linear Financial Data in Millions of Dollars (Except Share Data), 1992-2003 June Fiscal Year Income Statement Sales -Cost of Goods Sold -Research and Development Expense -Other Expenses Income Before Taxes -GAAP Income Taxes Net Income Common Shares Outstanding (Split-Adjusted) Earnings Per Share (Split-Adjusted) Dividends Paid-Preferred Dividends Paid-Common Share Price, Fiscal Year Close (Split-Adjusted) Cash Flow Statement Net Income +Depreciation and Amortization -Capital Expenditure -Working Capital Investments +Tax Adjustmentb Operating Cash Flow +Stock Issuance - Stock Purchases -Dividends Paid -Other Items Net Cash Flow Cash and Short-Term Investments 1992 119.4 49.5 12.3 19.1 38.5 13.5 25.0 280.2 $0.09 0.0 0.0 $2.36 25.0 4.5 9.8 7.2 6.4 19.0 11.7 0.7 0.0 0.0 30.0 95.3 1993 150.9 57.0 14.8 23.3 55.7 19.3 36.4 285.4 $0.13 0.0 5.3 $3.61 36.4 5.8 7.6 2.6 2.8 34.8 9.1 1.2 5.3 4.7 32.6 127.9 1994 200.5 67.6 18.4 28.0 86.5 29.7 56.8 290.5 $0.20 0.0 8.3 $5.50 56.8 6.3 16.2 6.8 6.1 46.3 13.7 1.3 8.3 1.5 48.9 176.8 1995 265.0 83.3 23.9 29.4 128.5 43.8 84.7 294.3 $0.29 0.0 9.8 $8.25 84.7 8.6 22.1 -4.5 6.2 81.8 7.6 6.1 9.8 0.0 73.4 250.2 1996 377.8 106.8 31.1 36.0 203.9 69.9 134.0 298.6 $0.45 0.0 11.9 $7.50 134.0 10.3 70.4 -9.1 11.3 94.3 12.7 22.9 11.9 0.0 72.3 322.5 1997 379.3 109.8 35.4 29.6 204.5 70.2 134.4 303.8 $0.44 0.0 15.0 $12.94 134.4 12.4 21.9 21.2 25.3 129.1 18.5 11.6 15.0 0.0 121.0 443.4 1998 484.8 137.8 46.2 29.6 271.3 90.4 180.9 307.3 $0.59 0.0 18.3 $15.08 180.9 20.1 24.4 -7.4 58.6 242.6 26.6 56.5 18.3 0.0 194.5 637.9 1999 506.7 139.8 54.7 26.5 285.7 91.4 194.3 307.5 $0.63 0.0 22.1 $33.63 194.3 22.0 39.1 -9.6 54.6 241.3 2000 705.9 179.0 78.3 31.4 417.3 129.4 287.9 315.2 $0.91 0.0 28.0 $63.94 287.9 25.0 80.3 -26.6 102.9 362.0 2001 54.8 0.0 28.0 0.0 388.9 972.6 231.1 102.5 28.4 610.7 183.2 427.5 318.9 $1.34 0.0 41.2 $44.22 427.5 35.8 127.9 19.2 115.5 431.7 38.3 52.7 108.7 69.8 22.1 41.2 0.0 0.0 148.8 373.4 786.7 1,175.6 1,549.0 Source: Adapted from Compustat. First three quarters of FY2003. The difference between the exercise price and the market value of LLTC stock could be expensed for tax purposes, leading to large tax adjustments on the cash flow statement. Other Items includes long-term investments and acquisitions (other than capital expenditure), extraordinary items, and other adjustments to net income. 2002 512.3 144.7 79.8 9.4 278.4 80.7 197.6 316.2 $0.63 0.0 54.0 $31.43 197.6 46.3 17.9 42.0 55.2 239.3 39.3 221.6 54.0 0.0 3.0 1,552.0 204-066 -9- 2003a 440.8 114.6 67.0 18.9 240.3 69.7 170.6 312.4 $0.55 0.0 47.0 $30.87 170.6 33.5 9.8 14.9 0.7 180.1 27.4 165.7 47.0 -18.4 13.2 1,565.2
Step by Step Solution
3.41 Rating (148 Votes )
There are 3 Steps involved in it

Get step-by-step solutions from verified subject matter experts