

Question: 2. Start the timer and release the cart. Stop the cart as it reaches the lower end of the incline. Don't ever let the cart
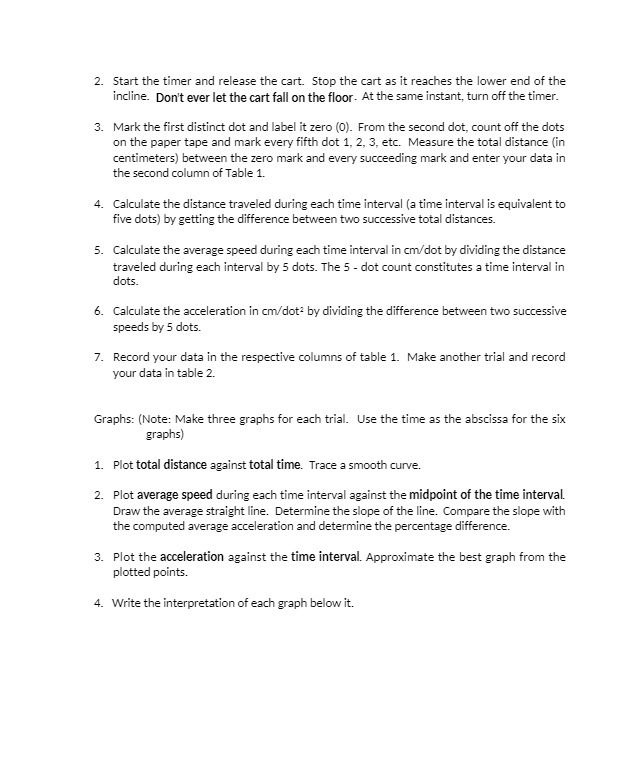
2. Start the timer and release the cart. Stop the cart as it reaches the lower end of the incline. Don't ever let the cart fall on the floor. At the same instant, turn off the timer. 3. Mark the first distinct dot and label it zero (0). From the second dot, count off the dots on the paper tape and mark every fifth dot 1, 2, 3, etc. Measure the total distance (in centimeters) between the zero mark and every succeeding mark and enter your data in the second column of Table 1. 4. Calculate the distance traveled during each time interval (a time interval is equivalent to five dots) by getting the difference between two successive total distances. 5. Calculate the average speed during each time interval in cm/dot by dividing the distance traveled during each interval by 5 dots. The 5 - dot count constitutes a time interval in dots. 6. Calculate the acceleration in cm/dot? by dividing the difference between two successive speeds by 5 dots. 7. Record your data in the respective columns of table 1. Make another trial and record your data in table 2. Graphs: (Note: Make three graphs for each trial. Use the time as the abscissa for the six graphs) 1. Plot total distance against total time. Trace a smooth curve. 2. Plot average speed during each time interval against the midpoint of the time interval. Draw the average straight line. Determine the slope of the line. Compare the slope with the computed average acceleration and determine the percentage difference. 3. Plot the acceleration against the time interval. Approximate the best graph from the plotted points. 4. Write the interpretation of each graph below it
Step by Step Solution
There are 3 Steps involved in it

Get step-by-step solutions from verified subject matter experts