

Question: 2. Study the graphs shown below. (a) Draw a vertical line on the first graph to represent E. Place the line so that about 100
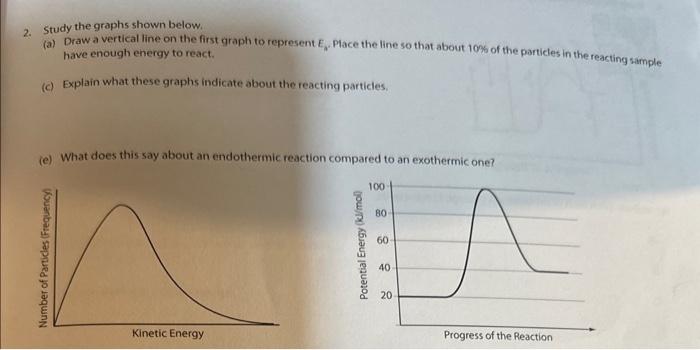
2. Study the graphs shown below. (a) Draw a vertical line on the first graph to represent E. Place the line so that about 100 of the particles in the reacting sample have enough energy to react. (c) Explain what these graphs indicate about the reacting particles. (e) What does this say about an endothermic reaction compared to an exothermic one
Step by Step Solution
There are 3 Steps involved in it
1 Expert Approved Answer
Step: 1 Unlock

Question Has Been Solved by an Expert!
Get step-by-step solutions from verified subject matter experts
Step: 2 Unlock
Step: 3 Unlock