

Question: 2. Suppose you are running an analysis on average amount of beer consumed based on 3 regions (Asia, Europe, North & South America). Data source:
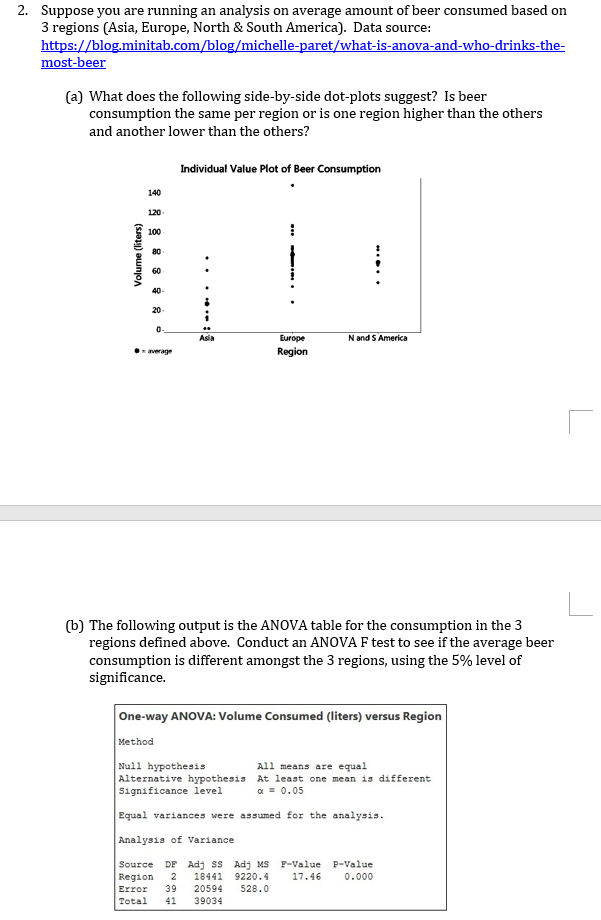
2. Suppose you are running an analysis on average amount of beer consumed based on 3 regions (Asia, Europe, North & South America). Data source: https://blog.minitab.com/blog/michelle-paret/what-is-anova-and-who-drinks-the- most-beer (a) What does the following side-by-side dot-plots suggest? Is beer consumption the same per region or is one region higher than the others and another lower than the others? Individual Value Plot of Beer Consumption 140 120 . 100 80 Volume (liters) 40 20 Asia Europe N and S America Region (b) The following output is the ANOVA table for the consumption in the 3 regions defined above. Conduct an ANOVA F test to see if the average beer consumption is different amongst the 3 regions, using the 5% level of significance. One-way ANOVA: Volume Consumed (liters) versus Region Method Null hypothesis All means are equal Alternative hypothesis At least one mean is different Significance level a = 0.05 Equal variances were assumed for the analysis. Analysis of Variance Source DF Adj SS Adj MS F-Value P-Value Region 2 18441 9220.4 17.46 0.000 Error 39 20594 528.0 Total 41 39034
Step by Step Solution
There are 3 Steps involved in it

Get step-by-step solutions from verified subject matter experts