

Question: 2 :t The rectangles in the graph below illustrate a left endpoint Riemann sum for f(:1:) : T + 2.7: on the interval [4, 8].
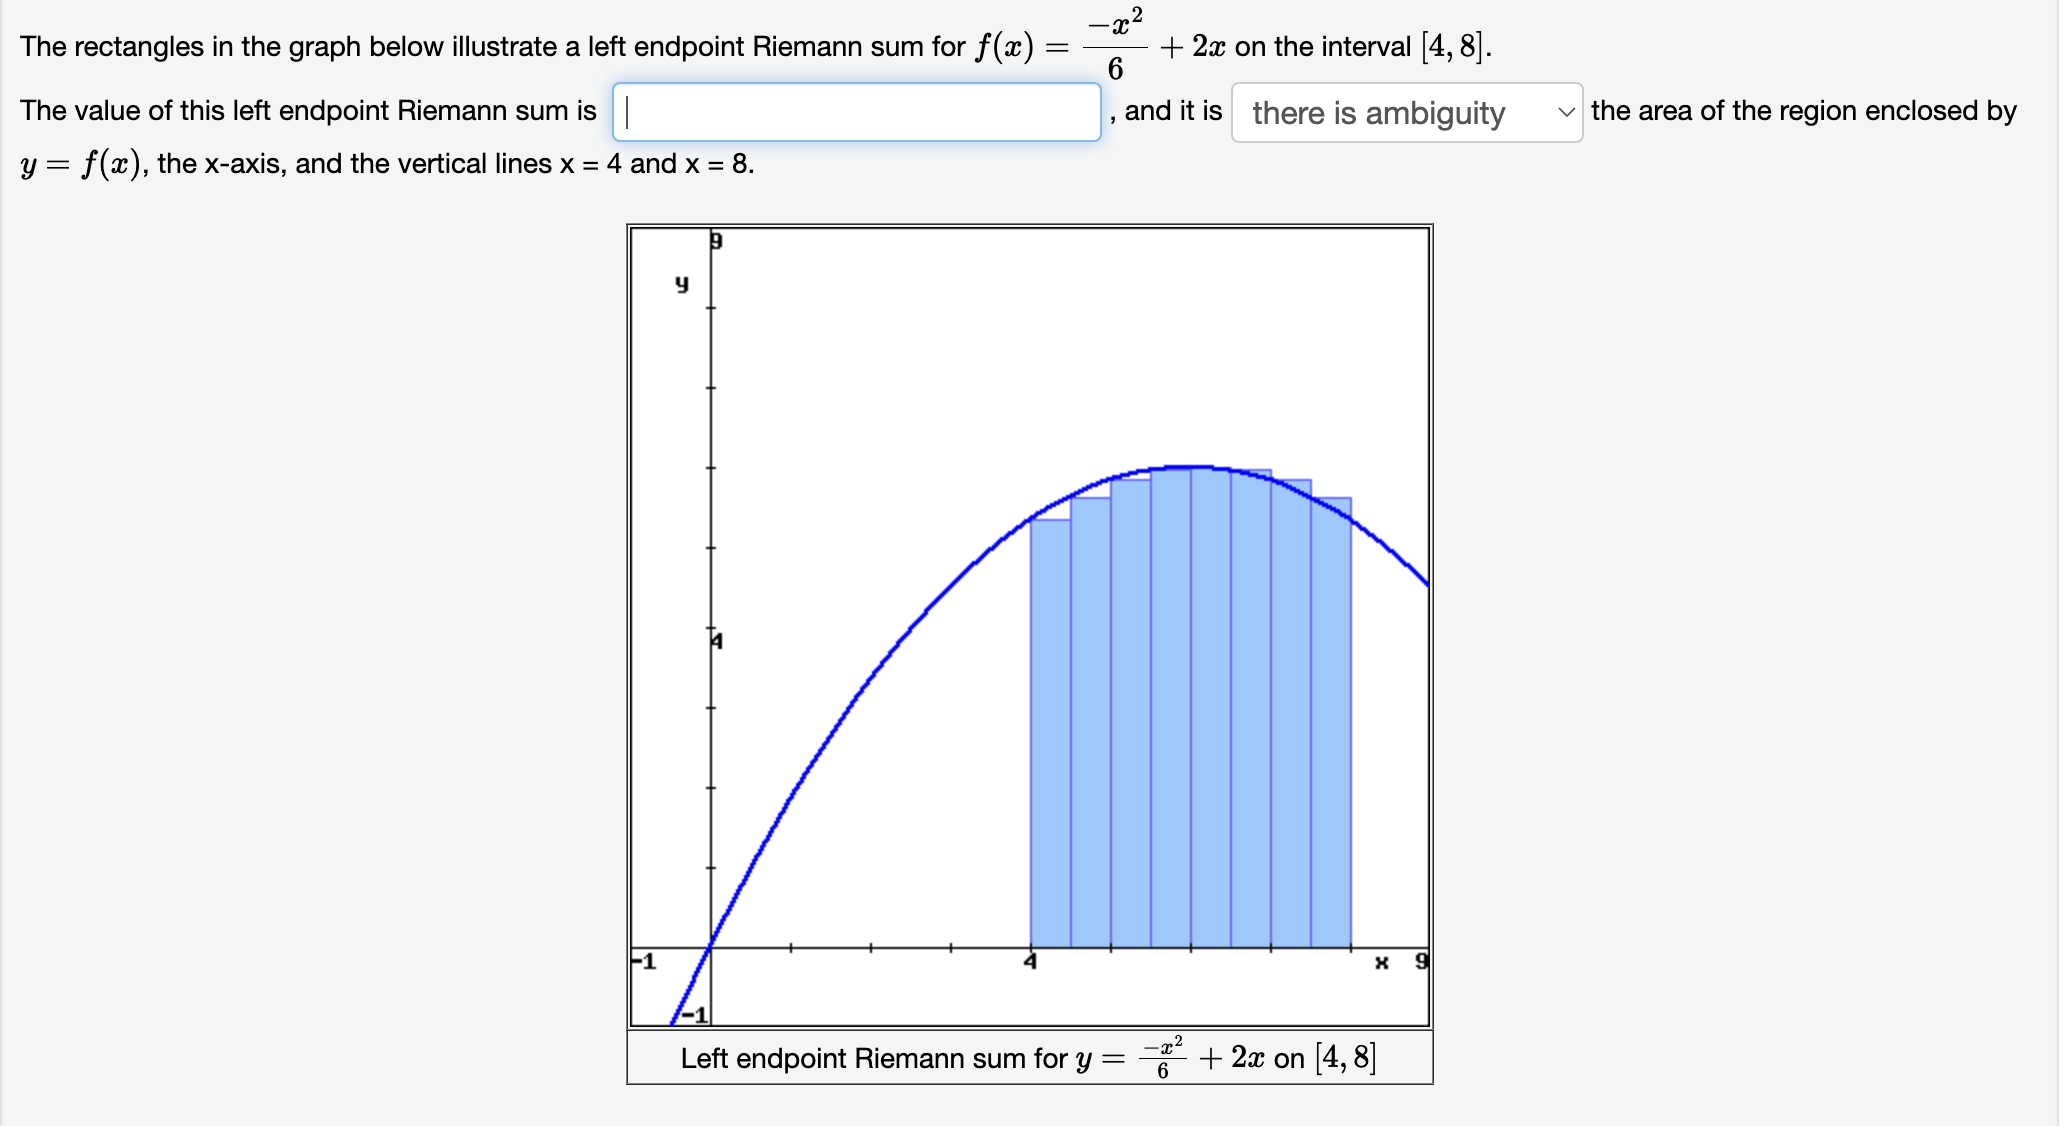
![[4, 8]. The value of this left endpoint Riemann sum is ,](https://s3.amazonaws.com/si.experts.images/answers/2024/06/66649ea921ce1_24866649ea8e9206.jpg)


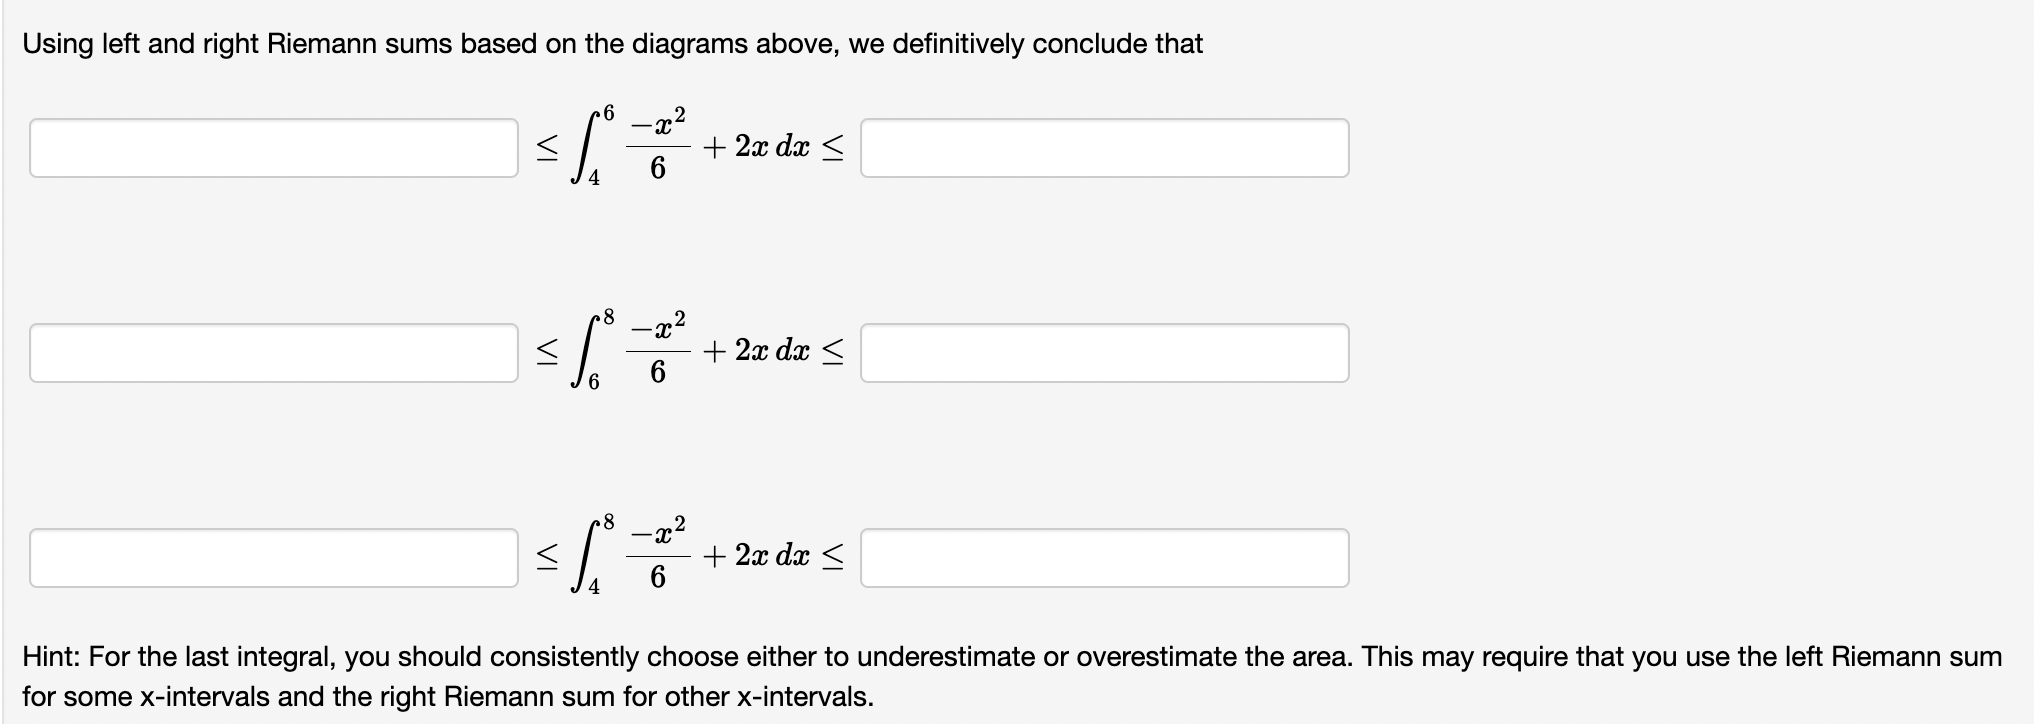
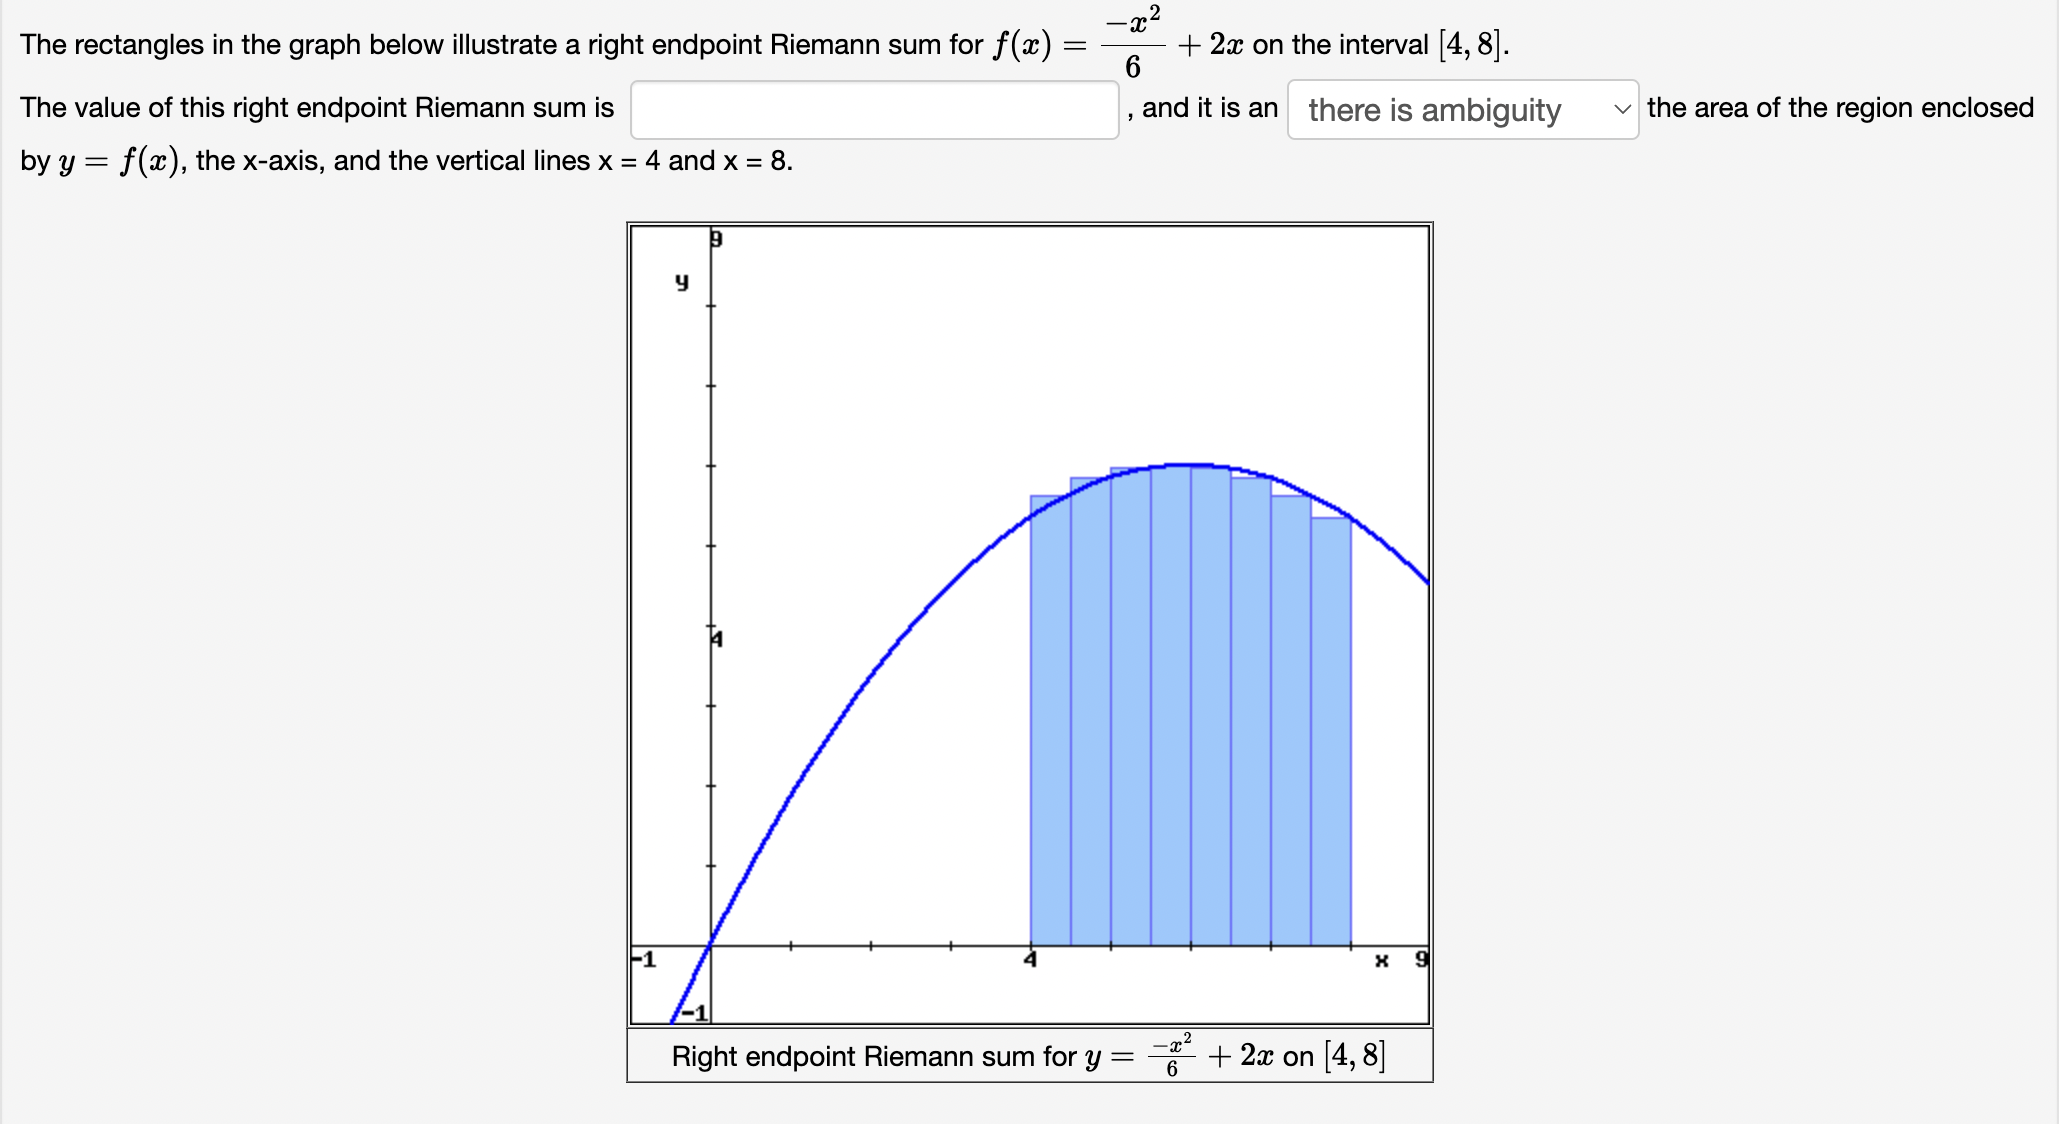
2 :t The rectangles in the graph below illustrate a left endpoint Riemann sum for f(:1:) : T + 2.7: on the interval [4, 8]. The value of this left endpoint Riemann sum is , and it is there is ambiguity v the area of the region enclosed by y : f(a:), the x-axis, and the vertical lines x = 4 and x = 8. Left endpoint Riemann sum for y : _Tm2 + 21: on [4, 8] 2 m The rectangles in the graph below illustrate a right endpoint Riemann sum for f(a:) 2 T + 2:13 on the interval [4, 8]. The value of this right endpoint Riemann sum is , and it is an there is ambiguity v the area of the region enclosed by y : ne), the xaxis, and the vertical lines x = 4 and x = 8. Right endpoint Riemann sum for y I 'TEZ + 22: on [4, 8] Using left and right Riemann sums based on the diagrams above, we definitively conclude that .2 2
Step by Step Solution
There are 3 Steps involved in it

Get step-by-step solutions from verified subject matter experts