

Question: 2 x The rectangles in the graph below illustrate a left endpoint Riemann sum for at) : g on the interval [2, 6]. The value
![endpoint Riemann sum for at) : g on the interval [2, 6].](https://s3.amazonaws.com/si.experts.images/answers/2024/06/66614577024af_80666614576dcaf4.jpg)
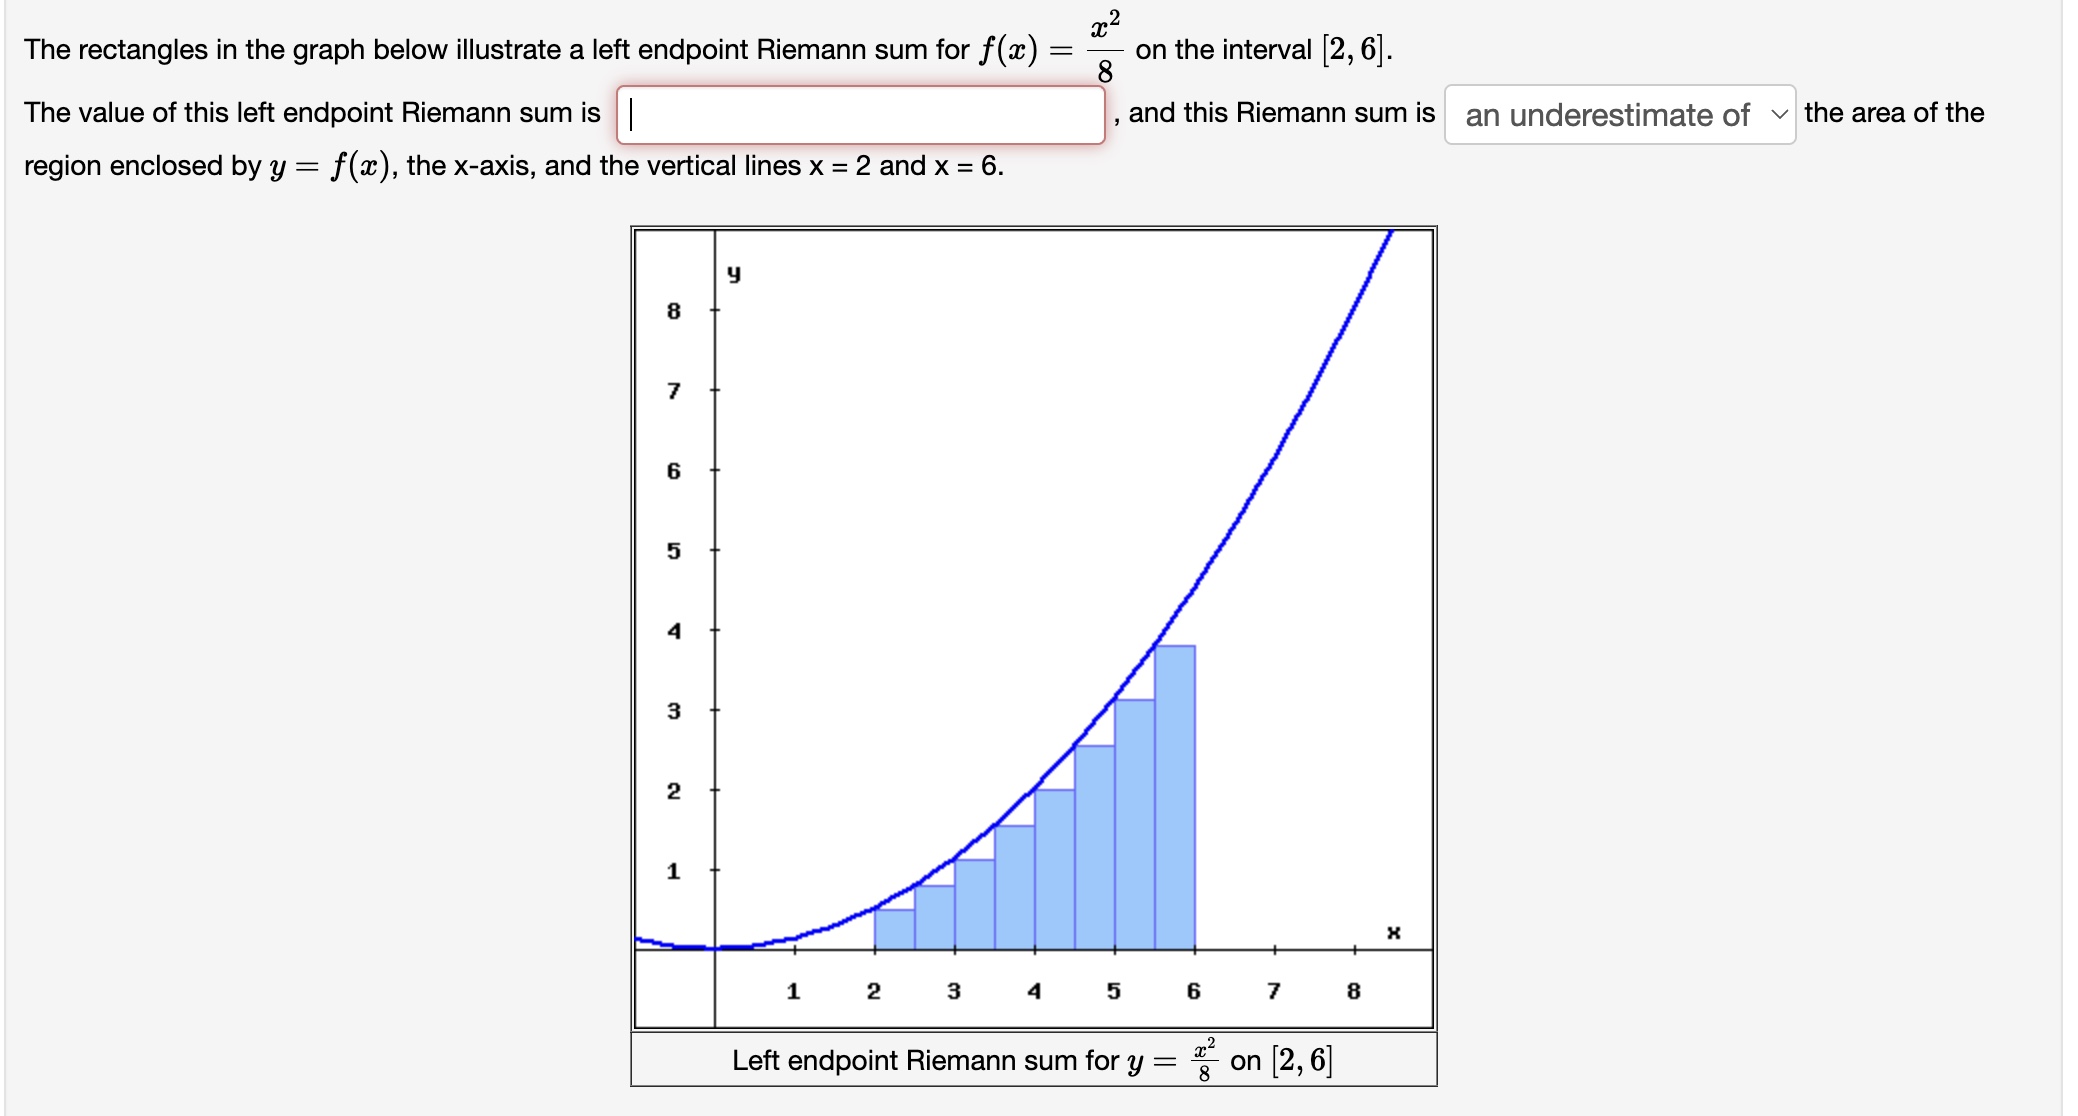
2 x The rectangles in the graph below illustrate a left endpoint Riemann sum for at) : g on the interval [2, 6]. The value of this left endpoint Riemann sum is | , and this Riemann sum is an underestimate of v the area of the region enclosed by y : f(:c), the xaxis, and the vertical lines x = 2 and x = 6. Left endpoint Riemann sum for y : %2 on [2, 6]
Step by Step Solution
There are 3 Steps involved in it
1 Expert Approved Answer
Step: 1 Unlock

Question Has Been Solved by an Expert!
Get step-by-step solutions from verified subject matter experts
Step: 2 Unlock
Step: 3 Unlock