

Question: 2. Table 1 below shows linear regression results. Based on the confidence level, interpret whether reject the null hypothesis, and the statistical significance of estimated

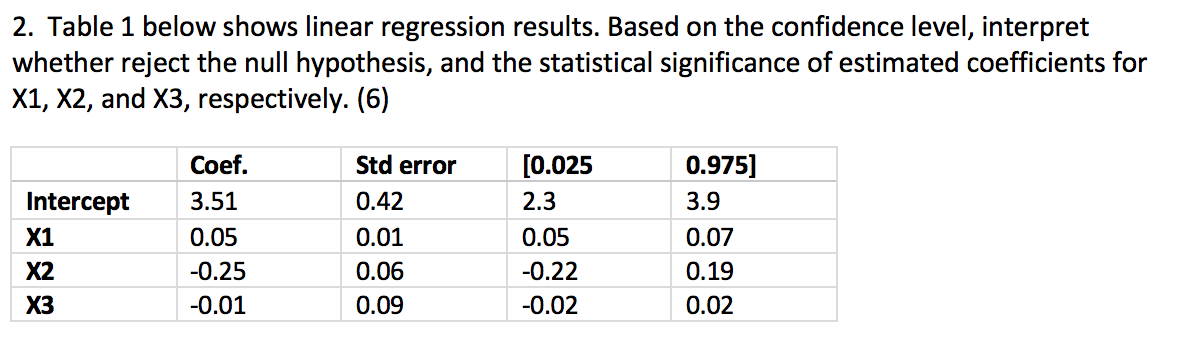
2. Table 1 below shows linear regression results. Based on the confidence level, interpret whether reject the null hypothesis, and the statistical significance of estimated coefficients for X1, X2, and X3, respectively. (6) Coef. Std error [0.025 0.975] Intercept 3.51 0.42 2.3 3.9 X1 0.05 0.01 0.05 0.07 X2 -0.25 0.06 -0.22 0.19 X3 -0.01 0.09 -0.02 0.02
Step by Step Solution
There are 3 Steps involved in it
1 Expert Approved Answer
Step: 1 Unlock

Question Has Been Solved by an Expert!
Get step-by-step solutions from verified subject matter experts
Step: 2 Unlock
Step: 3 Unlock