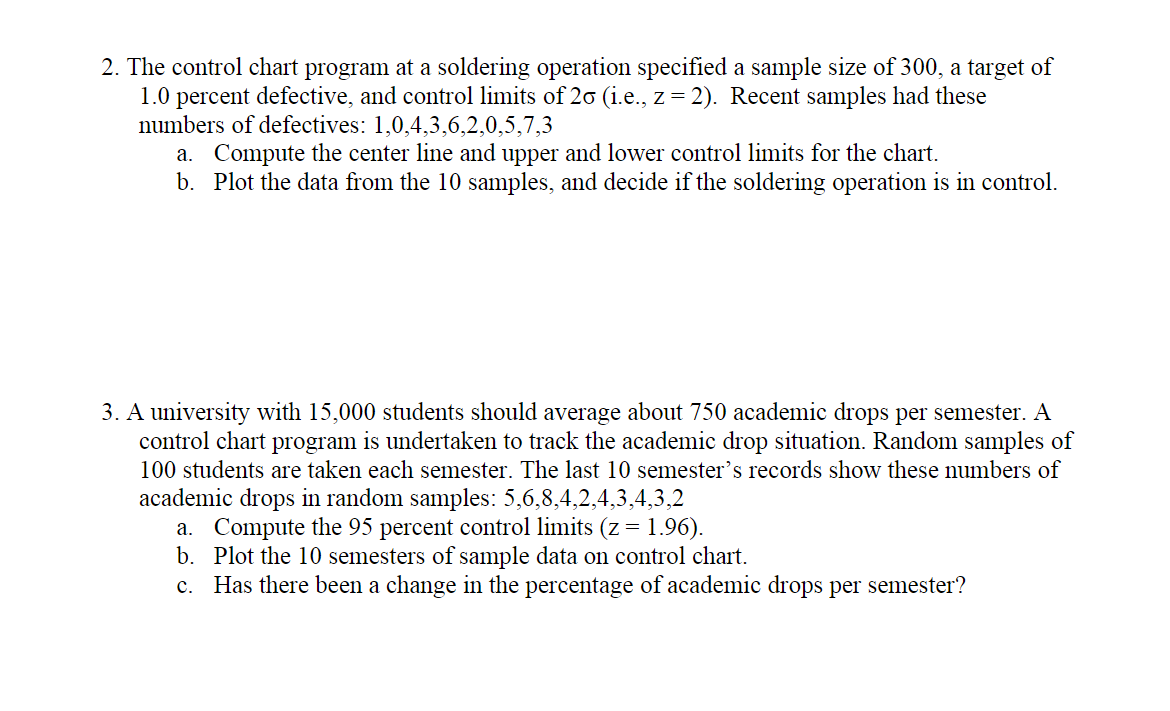
Question: 2. The control chart program at a soldering operation specified a sample size of 300, a target of 1.0 percent defective, and control limits of

2. The control chart program at a soldering

2. The control chart program at a soldering operation specified a sample size of 300, a target of 1.0 percent defective, and control limits of 20 (i.e., Z= 2). Recent samples had these numbers of defectives: 1,0,4,3,6,2,0,5,7,3 a. Compute the center line and upper and lower control limits for the chart. b. Plot the data from the 10 samples, and decide if the soldering operation is in control. 3. A university with 15,000 students should average about 750 academic drops per semester. A control chart program is undertaken to track the academic drop situation. Random samples of 100 students are taken each semester. The last 10 semester's records show these numbers of academic drops in random samples: 5,6,8,4,2,4,3,4,3,2 a. Compute the 95 percent control limits (z= 1.96). b. Plot the 10 semesters of sample data on control chart. c. Has there been a change in the percentage of academic drops per semester

Step by Step Solution

There are 3 Steps involved in it

1 Expert Approved Answer
Step: 1 Unlock blur-text-image
Question Has Been Solved by an Expert!

Get step-by-step solutions from verified subject matter experts

Step: 2 Unlock
Step: 3 Unlock

Students Have Also Explored These Related General Management Questions!