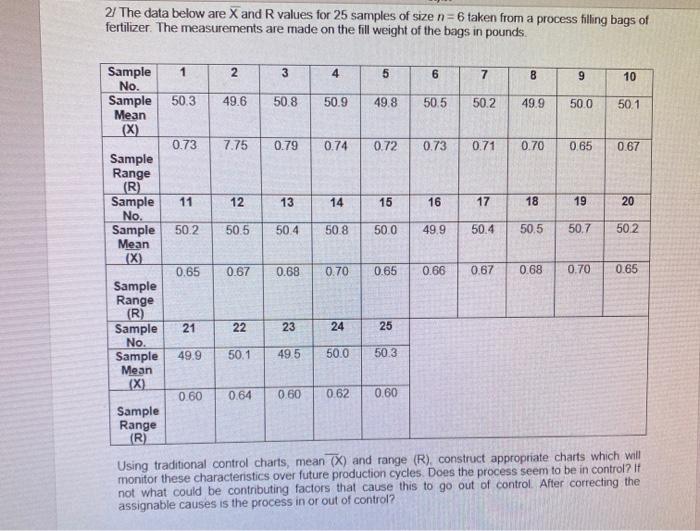
Question: 2/ The data below are X and R values for 25 samples of size n = 6 taken from a process filling bags of fertilizer.

2/ The data below are X and R values for 25
2/ The data below are X and R values for 25 samples of size n = 6 taken from a process filling bags of fertilizer. The measurements are made on the hill weight of the bags in pounds. 1 2 3 4 5 6 7 8 9 10 Sample No. Sample Mean 50.3 49.6 50.8 50.9 49.8 50.5 50.2 49.9 500 50.1 0.73 7.75 0.79 0.74 0.72 0.73 0.71 0.70 0.65 0.67 Sample Range (R) Sample No. ample Mean 11 12 13 14 15 16 17 18 19 20 50.2 50.5 50.4 50.8 500 49.9 50.4 50.5 50.7 502 0.65 0.67 0.68 0.70 0.65 0.66 0.67 0.68 0.70 0.65 Sample Range (R) Sample 21 22 23 24 25 No. Sample 49.9 50.1 495 50.0 503 Mean (X) 0.60 0.64 0.60 0.62 0.60 Sample Range (R) Using traditional control charts, mean (x) and range (R), construct appropriate charts which will monitor these characteristics over future production cycles. Does the process seem to be in control? If not what could be contributing factors that cause this to go out of control. After correcting the assignable causes is the process in or out of control

Step by Step Solution

There are 3 Steps involved in it

1 Expert Approved Answer
Step: 1 Unlock blur-text-image
Question Has Been Solved by an Expert!

Get step-by-step solutions from verified subject matter experts

Step: 2 Unlock
Step: 3 Unlock

Students Have Also Explored These Related General Management Questions!