

Question: Please each question answer indicate. 1. 2. 3. 4. Question 1 (0.5 points) Describe the difference between chance and assignable causes. Give examples. Question 2
Please each question answer indicate.
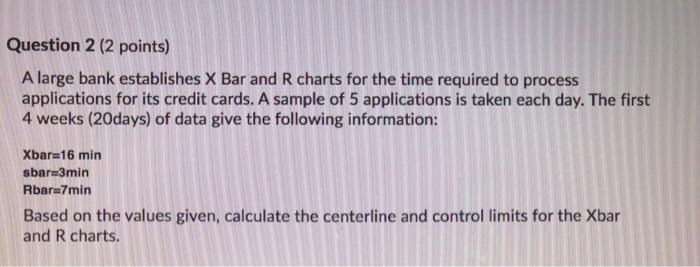
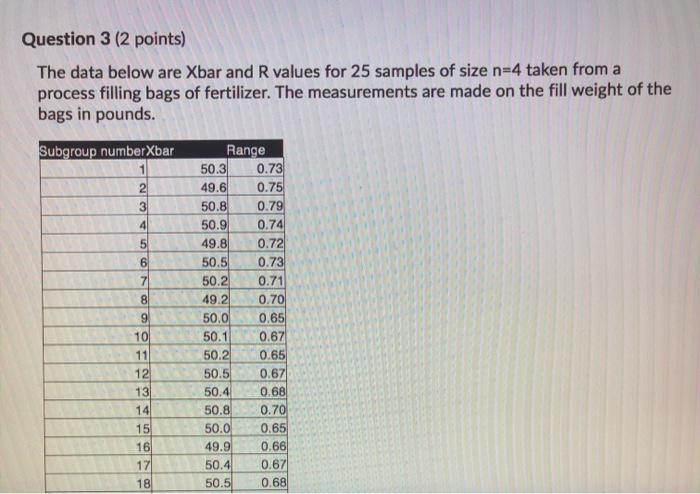
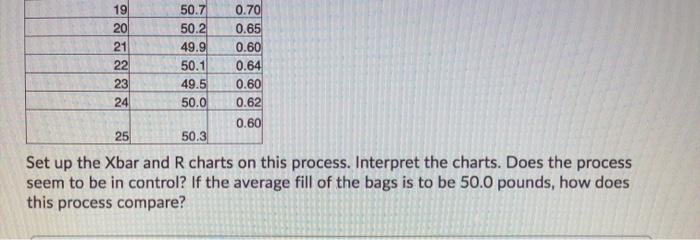
Question 1 (0.5 points) Describe the difference between chance and assignable causes. Give examples. Question 2 (2 points) A large bank establishes X Bar and R charts for the time required to process applications for its credit cards. A sample of 5 applications is taken each day. The first 4 weeks (20days) of data give the following information: Xbar=16 min sbar-3min Rbar=7min Based on the values given, calculate the centerline and control limits for the Xbar and R charts. Question 3 (2 points) The data below are Xbar and R values for 25 samples of size n=4 taken from a process filling bags of fertilizer. The measurements are made on the fill weight of the bags in pounds. Subgroup numberXbar Range 1 50.3 0.73 2 49.6 0.75 3 50.8 0.79 4 50.9 0.74 5 49.8 0.72 6 50,5 0.73 50.2 0.71 8 49.2 0.70 50.00 0.65 10 50.1 0.67 11 50.2 0.65 12 50.5 0.67 13 50.41 0.68 14 50.8 0.70 15 50.0 0.65 16) 49.9 0.66 17 50.4 0.67 18 50.5 0.68 19 20 21 22 23 24 50.7 50.2 49.9 50.1 49.5 50.0 0.70 0.65 0.60 0.64 0.60 0.62 0.60 25 50.3 Set up the Xbar and R charts on this process. Interpret the charts. Does the process seem to be in control? If the average fill of the bags is to be 50.0 pounds, how does this process compare? Question 4 (0.5 points) Describe how both an Xbar and R or s chart would look if they were under normal statistical control. Why is the use and interpretation of an R or s chart so critical when examing an Xbar chart 1. 
2.
3.
4.
Step by Step Solution
There are 3 Steps involved in it
1 Expert Approved Answer
Step: 1 Unlock

Question Has Been Solved by an Expert!
Get step-by-step solutions from verified subject matter experts
Step: 2 Unlock
Step: 3 Unlock