

Question: 2. The data in the table opposite shows the levels of contaminant in a chemical product: (a) Plot a histogram. (b) Plot an individuals or
2. The data in the table opposite shows the levels of contaminant in a chemical
product:
(a) Plot a histogram.
(b) Plot an individuals or run chart.
(c) Plot moving mean and moving range charts for grouped sample size
n = 4.
Interpret the results of these plots.
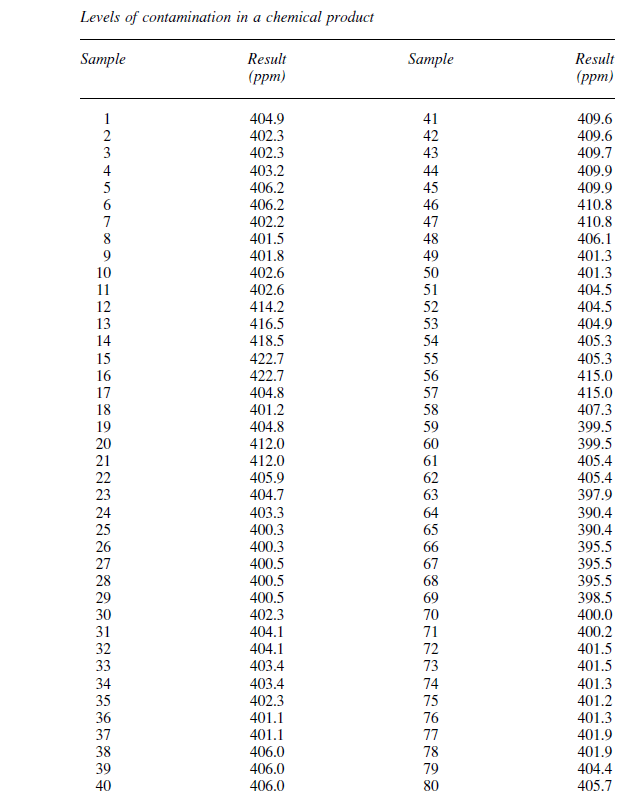
Levels of contamination in a chemical product Sample Result Sample Result (ppm) (ppm) 404.9 41 409.6 402.3 42 409.6 402.3 43 409.7 403.2 44 409.9 406.2 45 409.9 406.2 46 410.8 402.2 410.8 401.5 406.1 401.8 401.3 402.6 401.3 402.6 404.5 414.2 404.5 416.5 404.9 418.5 405.3 422.7 405.3 422.7 415.0 404.8 415.0 401.2 407.3 404.8 399.5 412.0 399.5 412.0 405.4 405.9 405.4 404.7 397.9 403.3 390.4 400.3 390.4 400.3 395.5 400.5 395.5 400.5 395.5 400.5 398.5 402.3 400.0 31 404.1 400.2 32 404.1 401.5 33 403.4 401.5 34 403.4 401.3 35 402.3 401.2 36 401.1 401.3 37 401.1 401.9 38 406.0 78 401.9 39 406.0 404.4 40 406.0 80 405.7
Step by Step Solution
There are 3 Steps involved in it

Get step-by-step solutions from verified subject matter experts