Question: 2. The data set c6p13 contains quarterly data on Upper Midwest car sales (CS) in thousands for 1996Q1 through 2016Q4. A. Prepare a time-series plot
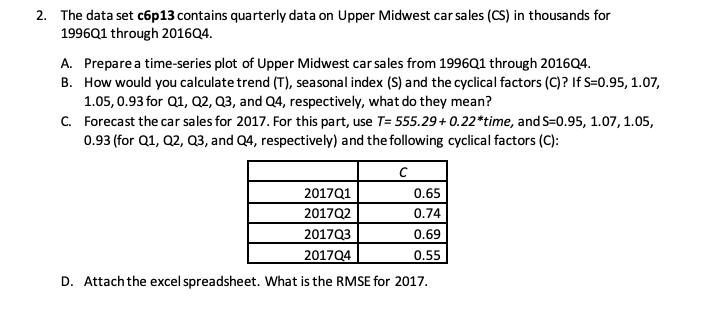
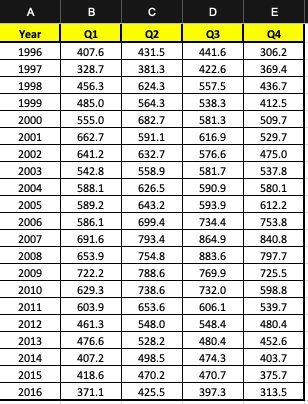
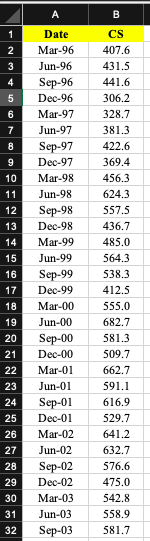
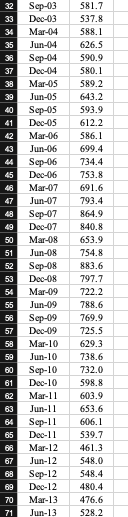
2. The data set c6p13 contains quarterly data on Upper Midwest car sales (CS) in thousands for 1996Q1 through 2016Q4.
A. Prepare a time-series plot of Upper Midwest car sales from 1996Q1 through 2016Q4.
B. How would you calculate trend (T), seasonal index (S) and the cyclical factors (C)? If S=0.95, 1.07, 1.05, 0.93 for Q1, Q2, Q3, and Q4, respectively, what do they mean?
C. Forecast the car sales for 2017. For this part, use T= 555.29 + 0.22*time, and S=0.95, 1.07, 1.05, 0.93 (for Q1, Q2, Q3, and Q4, respectively) and the following cyclical factors
(C): C 2017Q1 0.65 2017Q2 0.74 2017Q3 0.69 2017Q4 0.55 D. Attach the excel spreadsheet. What is the RMSE for 2017.
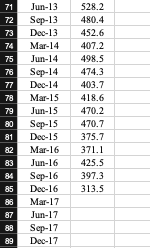
2. The data set c6p13 contains quarterly data on Upper Midwest car sales (CS) in thousands for 1996Q1 through 2016Q4. A. Prepare a time-series plot of Upper Midwest car sales from 1996Q1 through 2016Q4. B. How would you calculate trend (T), seasonal index (S) and the cyclical factors (C)? If S=0.95, 1.07, 1.05,0.93 for Q1, Q2, Q3, and Q4, respectively, what do they mean? C. Forecast the car sales for 2017. For this part, use T=555.29+ 0.22*time, and S=0.95, 1.07, 1.05, 0.93 (for Q1, Q2, Q3, and Q4, respectively) and the following cyclical factors (C): 2017Q1 0.65 201702 0.74 201703 0.69 201704 0.55 D. Attach the excel spreadsheet. What is the RMSE for 2017. A B C D E Q1 Q2 431.5 381.3 624.3 Year 1996 1997 1998 1999 2000 2001 2002 2003 2004 2005 2006 2007 2008 2009 2010 407.6 328.7 456.3 485.0 555.0 662.7 641.2 542.8 588.1 589.2 586.1 691.6 653.9 722.2 629.3 603.9 461.3 476.6 407.2 418.6 371.1 564.3 682.7 591.1 632.7 558.9 626.5 643.2 699.4 793.4 754.8 788.6 738.6 653.6 548.0 528.2 498.5 470.2 Q3 441.6 422.6 557.5 538.3 581.3 616.9 576.6 581.7 590.9 593.9 734.4 864.9 883.6 769.9 732.0 606.1 548.4 480.4 474.3 470.7 397.3 Q4 306.2 369.4 436.7 412.5 509.7 529.7 475.0 537.8 580.1 612.2 753.8 840.8 797.7 725.5 598.8 539.7 480.4 452.6 403.7 375.7 313.5 2011 2012 2013 2014 2015 2016 425.5 B 1 2 3 4 5 6 7 8 9 10 11 12 13 14 15 16 17 18 19 Date Mar-96 Jun-96 Sep-96 Dec-96 Mar-97 Jun-97 Sep-97 Dec-97 Mar-98 Jun-98 Sep-98 Dec-98 Mar-99 Jun-99 Sep-99 Dec-99 Mar-00 Jun-00 Sep-00 Dec-00 Mar-01 Jun-01 Sep-01 Dec-01 Mar-02 Jun-02 Sep-02 Dec-02 Mar-03 Jun-03 Sep-03 CS 407.6 431.5 441.6 306.2 328.7 381.3 422.6 369.4 456.3 624.3 557.5 436.7 485.0 564.3 538.3 412.5 555.0 682.7 581.3 509.7 662.7 591.1 616.9 529.7 641.2 632.7 576.6 475.0 542.8 558.9 581.7 20 21 22 23 24 25 26 27 28 29 30 31 32 32 33 34 35 37 38 39 40 41 45 48 50 51 52 53 54 55 58 57 58 59 60 61 Sep-03 Dec-03 Mar-04 Jun-04 Sep-04 Dec-04 Mar-OS Jun-05 Sep-05 Dec-05 Mar-06 Jun-06 Sep-06 Dec-06 Mar-07 Jun-07 Sep-07 Dec-07 Mar-08 Jun-08 Sep-08 Dec-08 Mar-09 Jun-09 Sep-09 Dec-09 Mar-10 Jun-10 Sep-10 Dec-10 Mar-11 Jun-11 Sep-11 Dec-11 Mar-12 Jun-12 Sep-12 Dec-12 Mar-13 Jun-13 581.7 537.8 588.1 626.5 590.9 580.1 589.2 643.2 593.9 612.2 586.1 699.4 734.4 753.8 691.6 793.4 864.9 840.8 653.9 754.8 883.6 797.7 722.2 788.6 769.9 725.5 629.3 738.6 732.0 598.8 603.9 653.6 606.1 539.7 461.3 548.0 548.4 480.4 476.6 528.2 63 64 65 68 67 68 69 70 71 71 T2 73 75 78 77 78 79 80 Jun-13 Sep-13 Dec-13 Mar-14 Jun-14 Sep-14 Dec-14 Mar-15 Jun-15 Sep-15 Dec-15 Mar-16 Jun-16 Sep-16 Dec-16 Mar-17 Jun-17 Sep-17 Dec-17 528.2 480.4 452.6 407.2 498.5 474.3 403.7 418.6 470.2 470.7 375.7 371.1 425.5 397.3 313.5 81 83 84 85 88 87 88 89


