

Question: 2. The data tuples in the following table are sorted by decreasing probability value, as returned by a classifier. For each tuple, compute the values
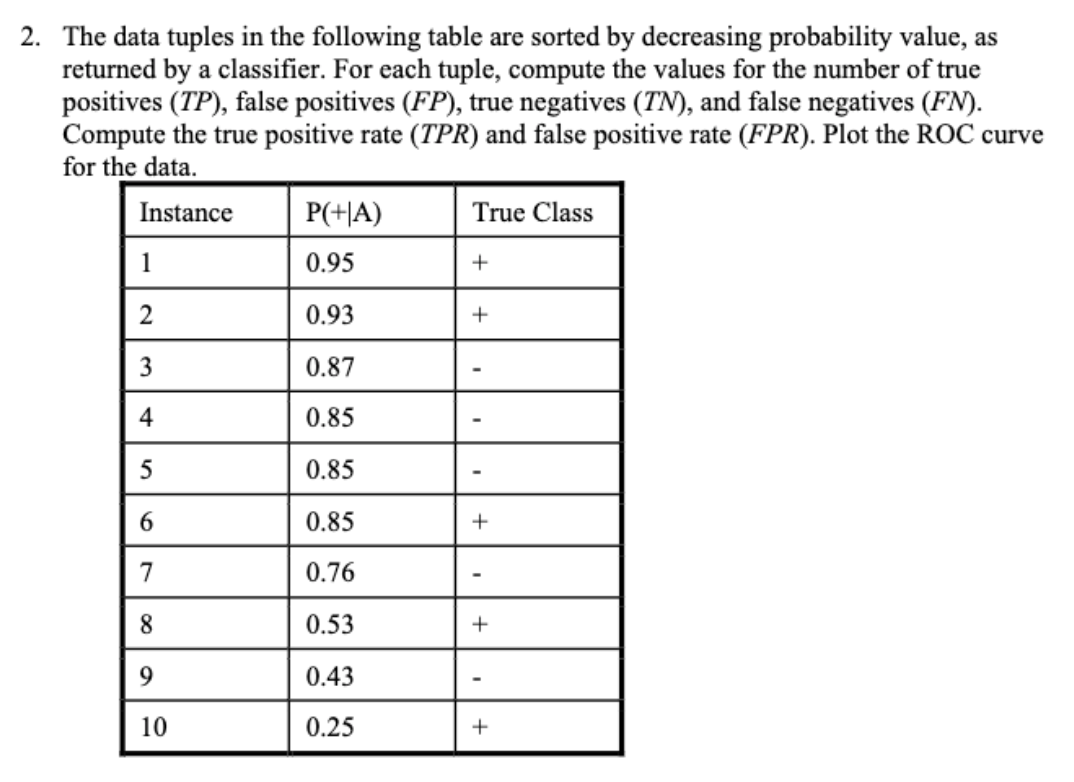
2. The data tuples in the following table are sorted by decreasing probability value, as returned by a classifier. For each tuple, compute the values for the number of true positives (TP), false positives (FP), true negatives (TN), and false negatives (FN). Compute the true positive rate (TPR) and false positive rate (FPR). Plot the ROC curve for the data. Instance P(+|A) True Class 1 0.95 + 2 0.93 + 3 0.87 4 0.85 5 0.85 6 0.85 + 7 0.76 8 0.53 + 9 0.43 10 0.25 +
Step by Step Solution
There are 3 Steps involved in it
1 Expert Approved Answer
Step: 1 Unlock

Question Has Been Solved by an Expert!
Get step-by-step solutions from verified subject matter experts
Step: 2 Unlock
Step: 3 Unlock