

Question: Need highlighted part. here is some example package and code given: install.packages(pROC) library(pROC) m1.roc = roc(true.label ~ m1.pred[,1]) plot(m1.roc, legacy = TRUE) auc(m1.roc) The data
 Need highlighted part.
here is some example package and code given:
install.packages("pROC") library(pROC) m1.roc = roc(true.label ~ m1.pred[,1]) plot(m1.roc, legacy = TRUE) auc(m1.roc)
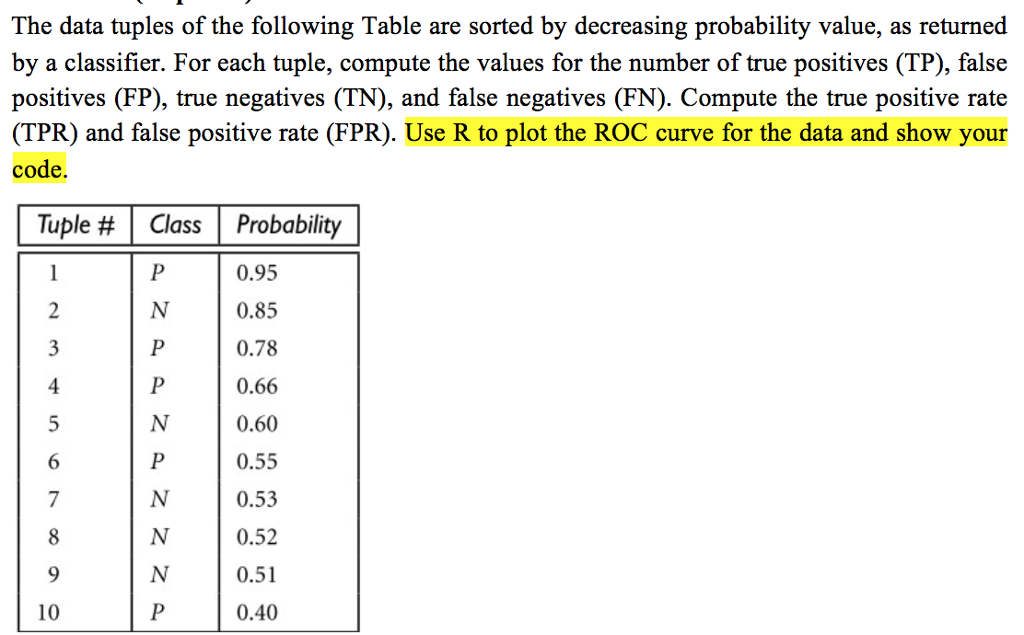
The data tuples of the following Table are sorted by decreasing probability value, as returned by a classifier. For each tuple, compute the values for the number of true positives (TP), false positives (FP), true negatives (TN), and false negatives (FN). Compute the true positive rate (TPR) and false positive rate (FPR). Use R to plot the ROC curve for the data and show your code. Tuple # | Class | Probability 0.95 0.85 0.78 0.66 0.60 0.55 0.53 0.52 0.51 0.40 4 10 The data tuples of the following Table are sorted by decreasing probability value, as returned by a classifier. For each tuple, compute the values for the number of true positives (TP), false positives (FP), true negatives (TN), and false negatives (FN). Compute the true positive rate (TPR) and false positive rate (FPR). Use R to plot the ROC curve for the data and show your code. Tuple # | Class | Probability 0.95 0.85 0.78 0.66 0.60 0.55 0.53 0.52 0.51 0.40 4 10
Step by Step Solution
There are 3 Steps involved in it

Get step-by-step solutions from verified subject matter experts