

Question: 2. The Exhibit Supplement provided in this note and in the teaching note spreadsheet extends the Exhibit 7 forecast for eight years. As a starting
2. The Exhibit Supplement provided in this note and in the teaching note spreadsheet extends the Exhibit 7 forecast for eight years. As a starting valuation, what do you believe the implied value of Whole Foods shares to be, based on this base-case forecast? For your discount rate, please use a market risk premium of 5.0%.
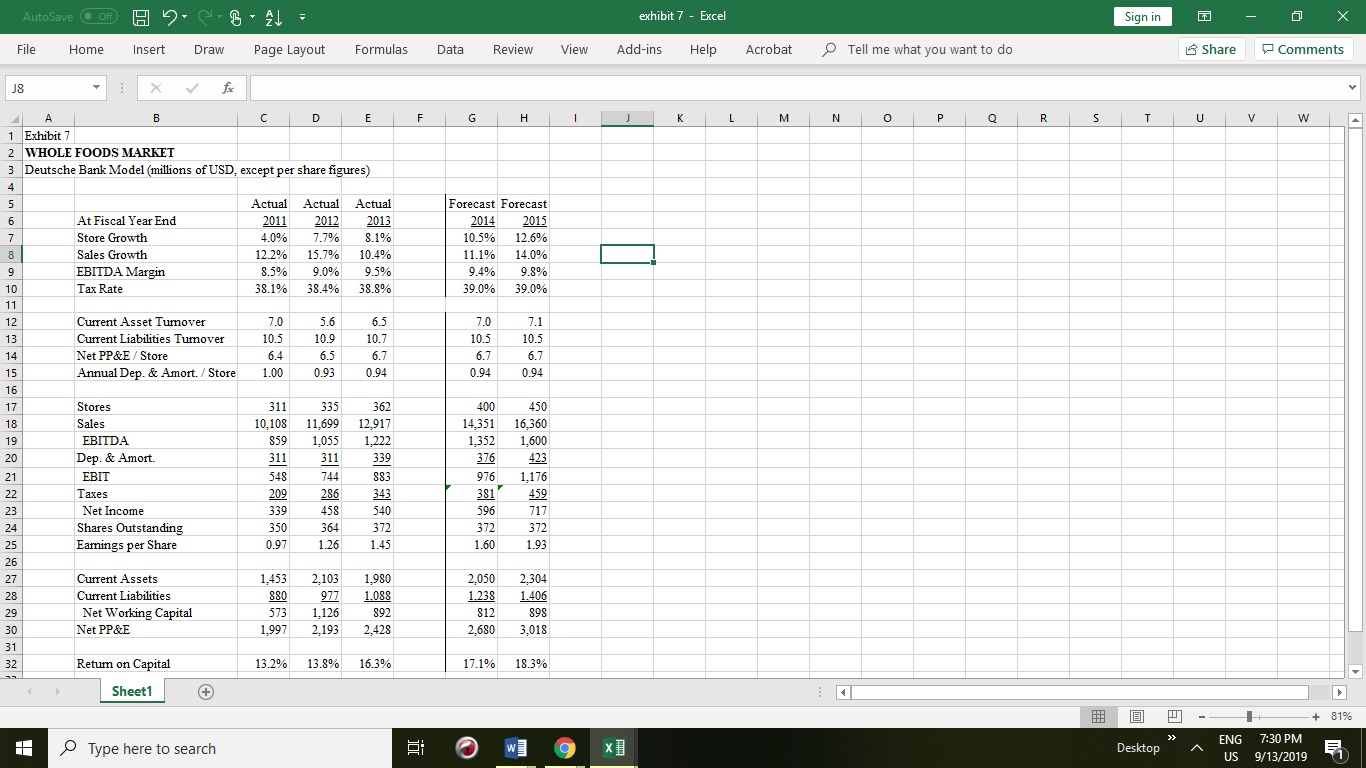
exhibit 7 - Excel Sign in - AutoSave OH File Home O Insert B Draw AL Page Layout o X Comments Formulas Data Review View Add-ins Help Acrobat Tell me what you want to do Share F F G H I J K L M N O P Q R S T U V W C D E 1 Exhibit 7 2 WHOLE FOODS MARKET 3 Deutsche Bank Model (millions of USD, except per share figures) At Fiscal Year End Store Growth Sales Growth EBITDA Margin Tax Rate Actual 2011 4.0% 12.2% 8.5% 38.1% Actual 2012 7.7% 15.7% 0.0% 38.4% Actual 2013 8.1% 10.4% 0.5% 38.8% Forecast Forecast 2014 2015 10.5% 12.6% 11.1% 14.0% 9.4% 9.8% 39.0% 39.0% 7.0 10.5 Current Asset Turnover Current Liabilities Turnover Net PP&E / Store Annual Dep. & Amort./ Store 7.0 10.5 6.4 1.00 5.6 10.9 6.5 0.93 6.5 10.7 6.7 0.94 7.1 10.5 6.7 6.7 0.94 0.94 311 10.108 859 Stores Sales EBITDA Dep. & Amort. EBIT Taxes Net Income Shares Outstanding Earnings per Share 335 11,699 1,055 311 744 286 458 364 1.26 548 209 362 12,917 1.222 339 883 343 540 372 1.45 400 14.351 1,352 376 976 450 16,360 1,600 423 1,176 459 717 372 1.93 381 339 350 0.97 596 372 1.60 2,050 1.238 Current Assets Current Liabilities Net Working Capital Net PP&E 1,453 880 573 1,997 2,103 977 1,126 2,193 1.980 1.088 892 2,428 2,304 1.406 898 3.018 812 2.680 13.2% 13.8% 16.3% 17.1% 18.3% Return on Capital Sheet1 @ J - - + 81% Type here to search Biwi 9 x] Desktop 4 ENG US 7:30 PM 9/13/2019 exhibit 7 - Excel Sign in - AutoSave OH File Home O Insert B Draw AL Page Layout o X Comments Formulas Data Review View Add-ins Help Acrobat Tell me what you want to do Share F F G H I J K L M N O P Q R S T U V W C D E 1 Exhibit 7 2 WHOLE FOODS MARKET 3 Deutsche Bank Model (millions of USD, except per share figures) At Fiscal Year End Store Growth Sales Growth EBITDA Margin Tax Rate Actual 2011 4.0% 12.2% 8.5% 38.1% Actual 2012 7.7% 15.7% 0.0% 38.4% Actual 2013 8.1% 10.4% 0.5% 38.8% Forecast Forecast 2014 2015 10.5% 12.6% 11.1% 14.0% 9.4% 9.8% 39.0% 39.0% 7.0 10.5 Current Asset Turnover Current Liabilities Turnover Net PP&E / Store Annual Dep. & Amort./ Store 7.0 10.5 6.4 1.00 5.6 10.9 6.5 0.93 6.5 10.7 6.7 0.94 7.1 10.5 6.7 6.7 0.94 0.94 311 10.108 859 Stores Sales EBITDA Dep. & Amort. EBIT Taxes Net Income Shares Outstanding Earnings per Share 335 11,699 1,055 311 744 286 458 364 1.26 548 209 362 12,917 1.222 339 883 343 540 372 1.45 400 14.351 1,352 376 976 450 16,360 1,600 423 1,176 459 717 372 1.93 381 339 350 0.97 596 372 1.60 2,050 1.238 Current Assets Current Liabilities Net Working Capital Net PP&E 1,453 880 573 1,997 2,103 977 1,126 2,193 1.980 1.088 892 2,428 2,304 1.406 898 3.018 812 2.680 13.2% 13.8% 16.3% 17.1% 18.3% Return on Capital Sheet1 @ J - - + 81% Type here to search Biwi 9 x] Desktop 4 ENG US 7:30 PM 9/13/2019
Step by Step Solution
There are 3 Steps involved in it

Get step-by-step solutions from verified subject matter experts