

Question: The Exhibit Supplement provided extends the Exhibit 7 forecast for eight years. As a starting valuation , what do you believe the implied value of
The Exhibit Supplement provided extends the Exhibit 7 forecast for eight years. As a starting valuation, what do you believe the implied value of Whole Foods shares to be, based on this base-case forecast? For your discount rate, please use a market risk premium of 5.0%.
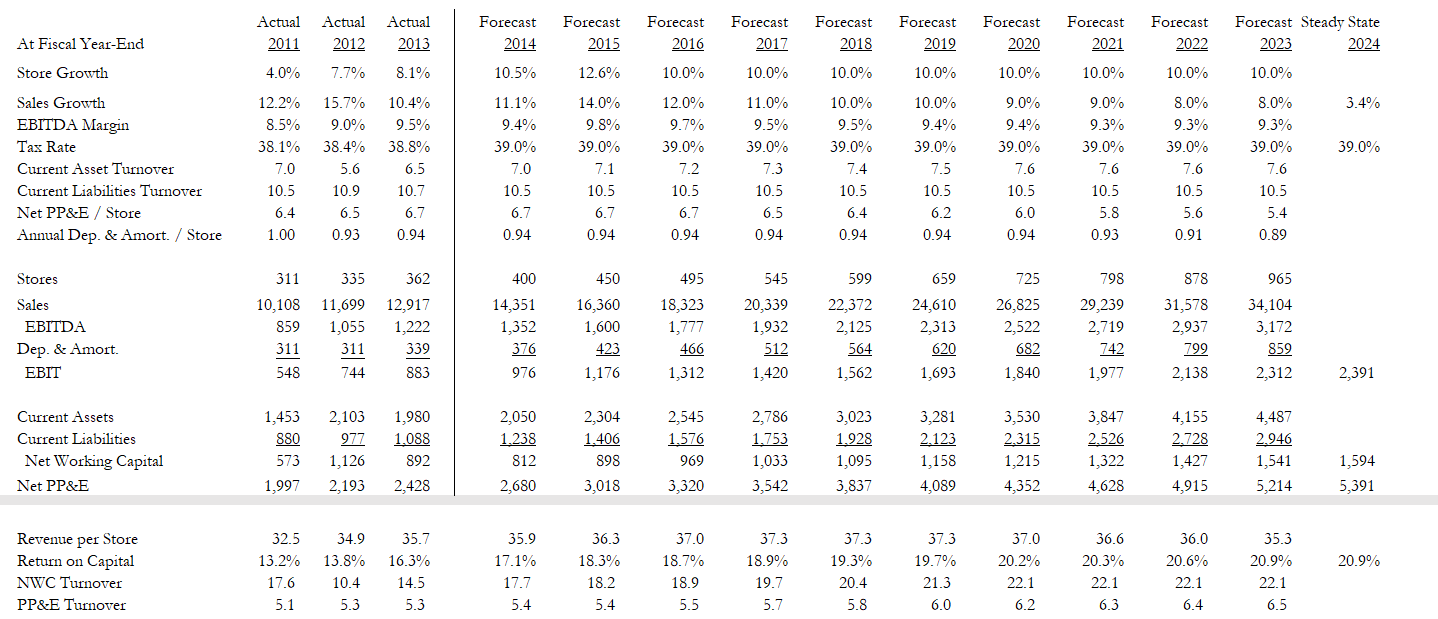
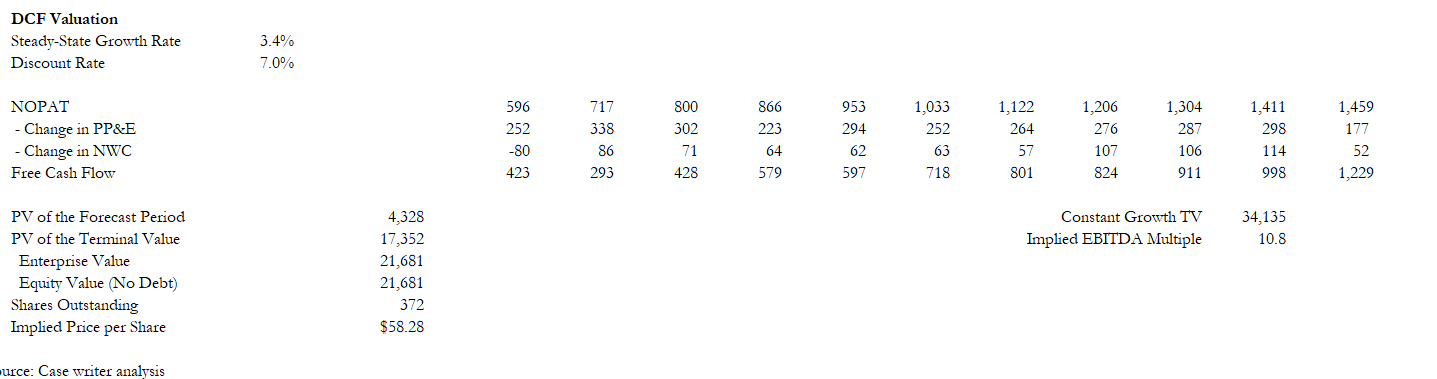
Actual 2011 Actual 2012 Actual 2013 Forecast 2014 Forecast 2015 Forecast 2016 Forecast 2017 Forecast 2018 Forecast 2019 Forecast 2020 Forecast 2021 Forecast 2022 Forecast Steady State 2023 2024 At Fiscal Year-End Store Growth 4.0% 7.7% 8.1% 10.5% 12.6% 10.0% 10.0% 10.0% 10.0% 10.0% 10.0% 10.0% 10.0% 3.4% Sales Growth EBITDA Margin Tax Rate Current Asset Turnover Current Liabilities Turnover Net PP&E / Store Annual Dep. & Amort / Store 12.2% 8.5% 38.1% 7.0 10.5 15.7% 9.0% 38.4% 5.6 10.9 6.5 0.93 39.0% 10.4% 9.5% 38.8% 6.5 10.7 6.7 11.1% 9.4% 39.0% 7.0 10.5 6.7 0.94 14.0% 9.8% 39.0% 7.1 10.5 6.7 0.94 12.0% 9.7% 39.0% 7.2 10.5 11.0% 9.5% 39.0% 7.3 10.5 6.5 0.94 10.0% 9.5% 39.0% 7.4 10.5 10.0% 9.4% 39.0% 7.5 10.5 6.2 0.94 9.0% 9.4% 39.0% 7.6 10.5 6.0 9.0% 9.3% 39.0% 7.6 10.5 5.8 0.93 8.0% 9.3% 39.0% 7.6 10.5 5.6 0.91 8.0% 9.3% 39.0% 7.6 10.5 5.4 0.89 6.4 6.7 6.4 0.94 1.00 0.94 0.94 0.94 311 362 400 450 495 545 659 725 965 Stores Sales EBITDA Dep. & Amort. EBIT 10,108 859 311 548 335 11,699 1,055 311 744 12,917 1,222 339 883 14,351 1,352 376 976 16,360 1,600 423 1,176 18,323 1,777 466 1,312 20,339 1,932 512 1,420 599 22,372 2.125 564 1,562 24,610 2.313 620 1,693 26,825 2,522 682 1,840 798 29,239 2,719 742 1,977 878 31,578 2,937 799 2,138 34,104 3,172 859 2.312 2,391 Current Assets Current Liabilities Net Working Capital Net PP&E 1,453 880 573 1,997 2,103 977 1,126 2,193 1,980 1.088 892 2,428 2,050 1.238 812 2,680 2,304 1.406 898 3,018 2,545 1.576 969 3,320 2,786 1.753 1,033 3,542 3,023 1.928 1,095 3,837 3,281 2.123 1,158 4,089 3,530 2.315 1.215 4,352 3,847 2.526 1,322 4,628 4,155 2.728 1,427 4,915 4,487 2.946 1,541 5,214 1,594 5,391 20.9% Revenue per Store Return on Capital NWC Turnover PP&E Turnover 32.5 13.2% 17.6 5.1 34.9 13.8% 10.4 5.3 35.7 16.3% 14.5 5.3 35.9 17.1% 17.7 5.4 36.3 18.3% 18.2 5.4 37.0 18.7% 18.9 5.5 37.3 18.9% 19.7 5.7 37.3 19.3% 20.4 5.8 37.3 19.7% 21.3 6.0 37.0 20.2% 22.1 6.2 36.6 20.3% 22.1 6.3 36.0 20.6% 22.1 6.4 35.3 20.9% 22.1 6.5 DCF Valuation Steady-State Growth Rate Discount Rate 3.4% 7.0% 800 1,122 264 NOPAT - Change in PP&E Change in NWC Free Cash Flow 596 252 -80 423 717 338 86 293 302 71 428 866 223 64 579 953 294 62 597 1,033 252 63 718 1,206 276 107 824 1,304 287 106 911 1,411 298 114 998 1,459 177 52 1,229 57 801 4,328 Constant Growth TV Implied EBITDA Multiple 34.135 10.8 PV of the Forecast Period PV of the Terminal Value Enterprise Value Equity Value No Debt) Shares Outstanding Implied Price per Share 17,352 21,681 21,681 372 $58.28 urce: Case writer analysis
Step by Step Solution
There are 3 Steps involved in it

Get step-by-step solutions from verified subject matter experts