

Question: 2. The figure below illustrates an Up-Down predictor point and 10 Up-Down (saturating counter) predicts . taken when 11 and 10 Fill out the tables
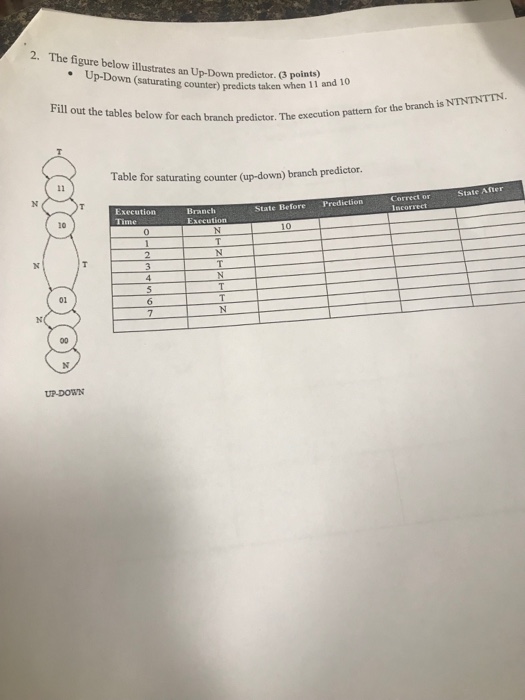
2. The figure below illustrates an Up-Down predictor point and 10 Up-Down (saturating counter) predicts . taken when 11 and 10 Fill out the tables below for cach branch predictor. The execution pattern for the branch is NTNTNTTN. predictor. The Table for saturating counter (up-down) branch predictor. State After Correct or Branch State Before Prediction Execution Time 10 01
Step by Step Solution
There are 3 Steps involved in it
1 Expert Approved Answer
Step: 1 Unlock

Question Has Been Solved by an Expert!
Get step-by-step solutions from verified subject matter experts
Step: 2 Unlock
Step: 3 Unlock