

Question: 2. The figure below shows a velocity-time graph for a ball bouncing vertically on a hard surface. v/m s 5- 1,0 210 -t/s 0 (a)
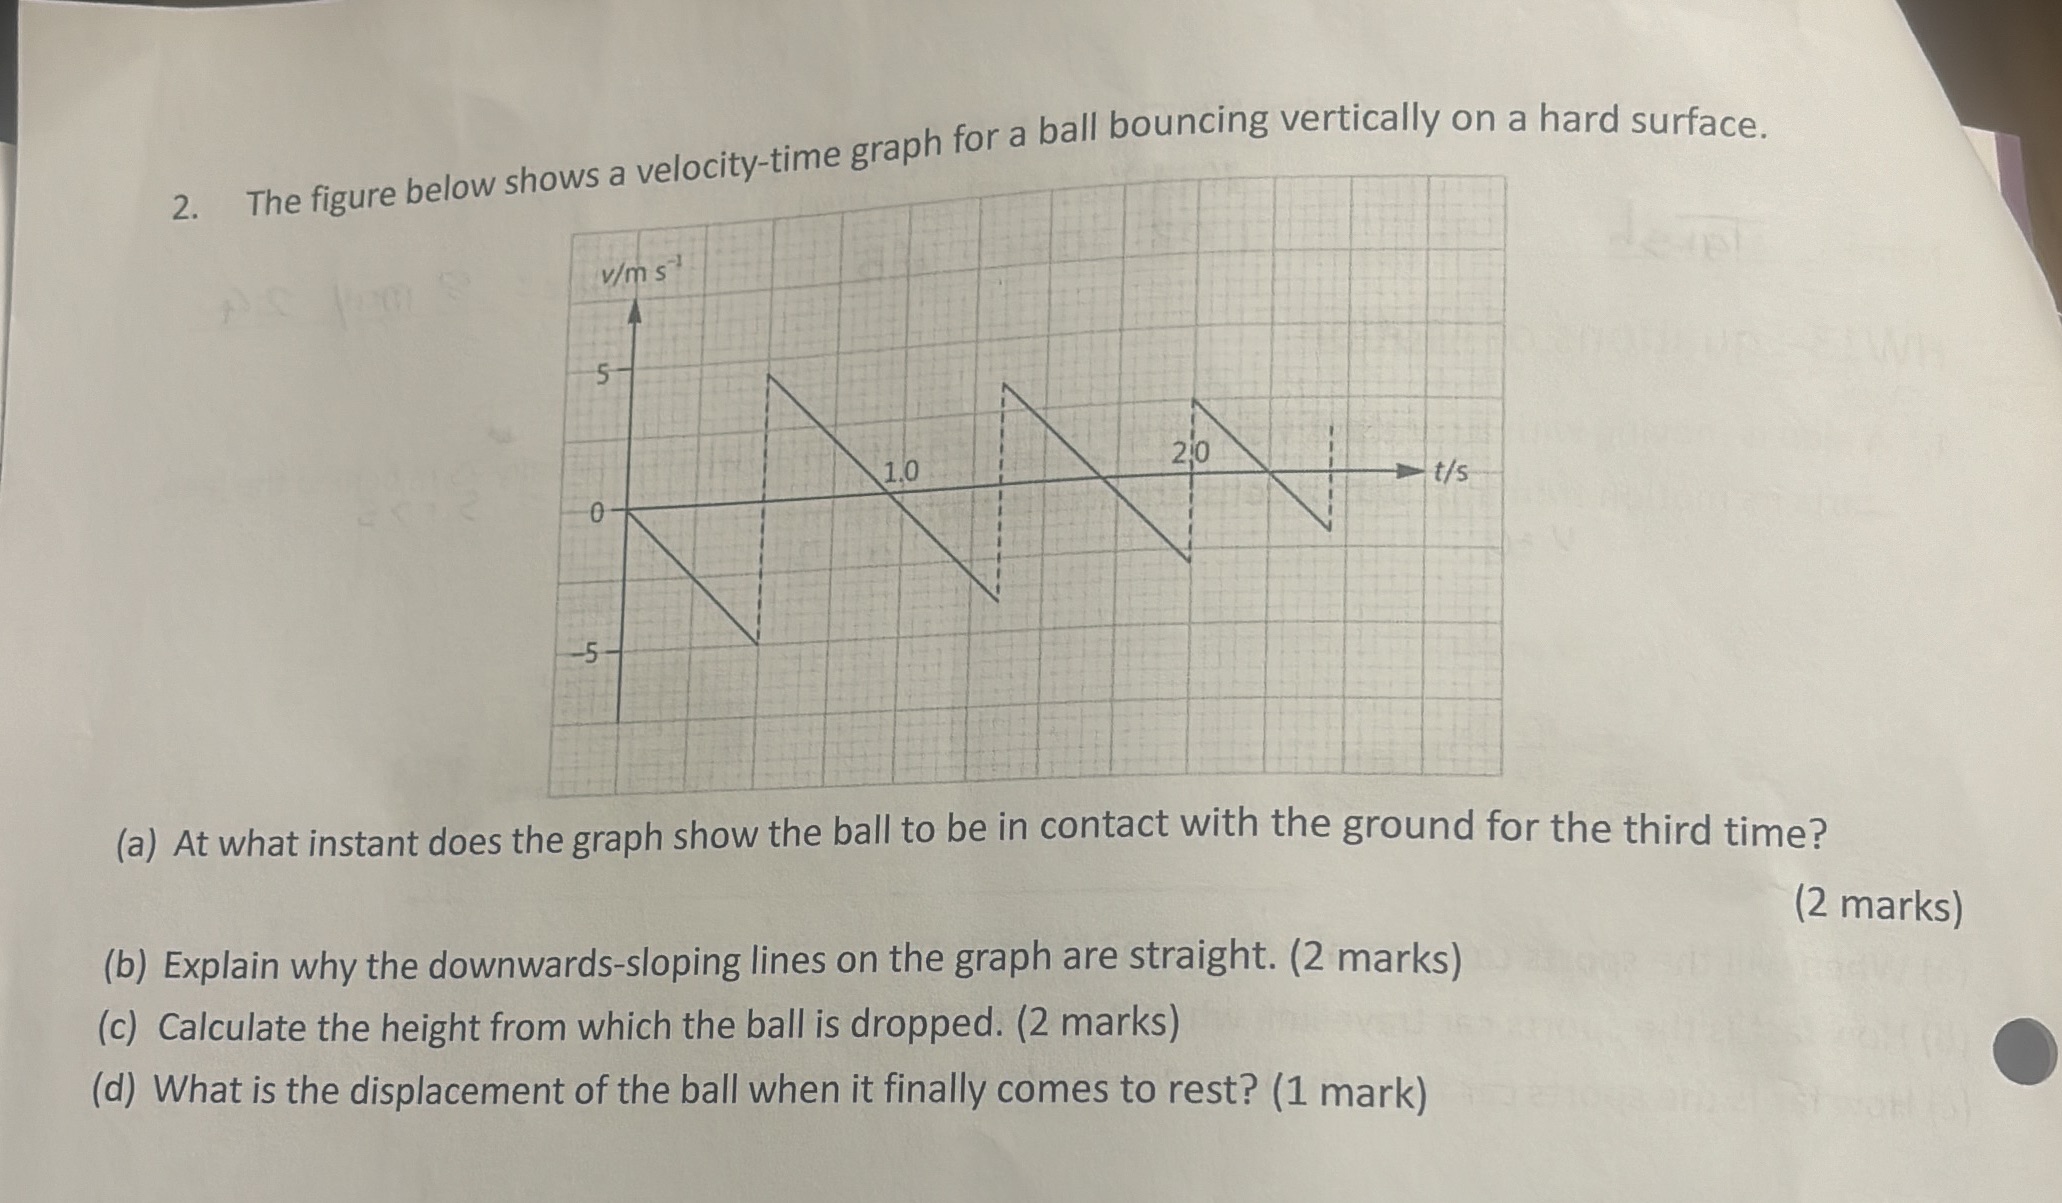
2. The figure below shows a velocity-time graph for a ball bouncing vertically on a hard surface. v/m s 5- 1,0 210 -t/s 0 (a) At what instant does the graph show the ball to be in contact with the ground for the third time? (2 marks) (b) Explain why the downwards-sloping lines on the graph are straight. (2 marks) (c) Calculate the height from which the ball is dropped. (2 marks) (d) What is the displacement of the ball when it finally comes to rest? (1 mark)
Step by Step Solution
There are 3 Steps involved in it
1 Expert Approved Answer
Step: 1 Unlock

Question Has Been Solved by an Expert!
Get step-by-step solutions from verified subject matter experts
Step: 2 Unlock
Step: 3 Unlock